Summary for the Impatient
Postgres 19 ships SQL/PGQ, the standard graph-query syntax, with a GRAPH_TABLE operator you write patterns against. I pointed ExoBench at a PostgreSQL 19beta1 build to see what the machine underneath actually does. Two findings.
For a fixed-depth query, the parent-to-many-to-many-to-many-nodes kind, the graph query and the hand-written join compile to an identical plan and run at the identical time, because SQL/PGQ is a rewriter that turns the pattern into joins. For the variable-depth query, i.e. "everything downstream at any depth," which is what graph databases were built for, PG19 does not actually support the syntax (not even -[edge]{X,Y}) so I had to write a recursive CTE to get stats. Apache AGE gives you the Cypher quantifier that PG19 lacks, at roughly 2x the cost of the recursive CTE, because it runs the same indexed traversal with a function-scan layer on top. None of it is the index-free adjacency of a native graph engine. Every number below is 19beta1 and may move at GA.
A Soft Spot for Graphs
I have had a soft spot for graph databases since the 2010s, when the semantic web and SPARQL were going to reorganize all of human knowledge into triples. I jumped into triple-stores because certain questions that were nightmares in SQL became trivial to ask. Then reality showed up. SPARQL was slow, and the indexes needed to make it not-slow ate up storage at a rate that made DBAs quietly close the tab.
The semantic web was going to turn every fact on the internet into a queryable triple. It turned into a stack of six indexes per store and a storage bill that outgrew the data inside. The era was dead on arrival.
Fortunately the idea did not complete extinguish, it just scattered. Neo4j and Cypher found a home, Gremlin and Apache TinkerPop found another, and each carved out a niche in it's respective use-cases. Neo4j came out of a specific corner: enterprise content-management systems whose access-checks turned into intractable self-join piles. Gremlin found its niche as a vendor-neutral traversal-language that walks a dozen different graph engines instead of needing a new dialect per store. The use cases that actually stuck were the ones where relationships are the product: recommendation engines, social graphs, fraud-ring detection, networks, and knowledge graphs.
Now the most widely deployed database in the world is growing a graph-query engine. Postgres 19 implements SQL/PGQ, the ISO graph-query standard, following SQL Server, which shipped graph tables back in 2017 (to a reception I would describe as polite). When Postgres does a thing, the thing becomes real for a very large number of people who were never going to install Neo4j. So maybe this is the second chance graph queries never quite got.
Arrows make The Point
The reason I liked these things is that a graph query models relationships, not just the entities. For the right question this makes it read like a sentence. Here is the one this whole post is built on. Given one flaky load balancer, find every index shard node four typed hops downstream:
SELECT node_id
FROM GRAPH_TABLE (infra
  MATCH (lb IS LoadBalancer WHERE lb.id = 1)
        -[IS routes]->     (ig IS Ingress)
        -[IS dispatches]-> (cl IS IndexCluster)
        -[IS shards]->     (ss IS IndexShardServer)
        -[IS replicates]-> (sn IS IndexShardNode)
  COLUMNS (sn.id AS node_id)
);
The arrows are the topology. Start at load balancer 1, follow routes to an ingress, dispatches to a cluster, shards to a shard server, replicates to a shard node, then hand back the shard node. It is the whiteboard diagram, written down. That is the promise of graph-form queries.
Here is the same five-layer topology, drawn small enough to read. Real infrastructure is a DAG, not a tree, so I gave it one redundant route to make the point: some things downstream go dark, and some survive because a second load balancer still reaches them.
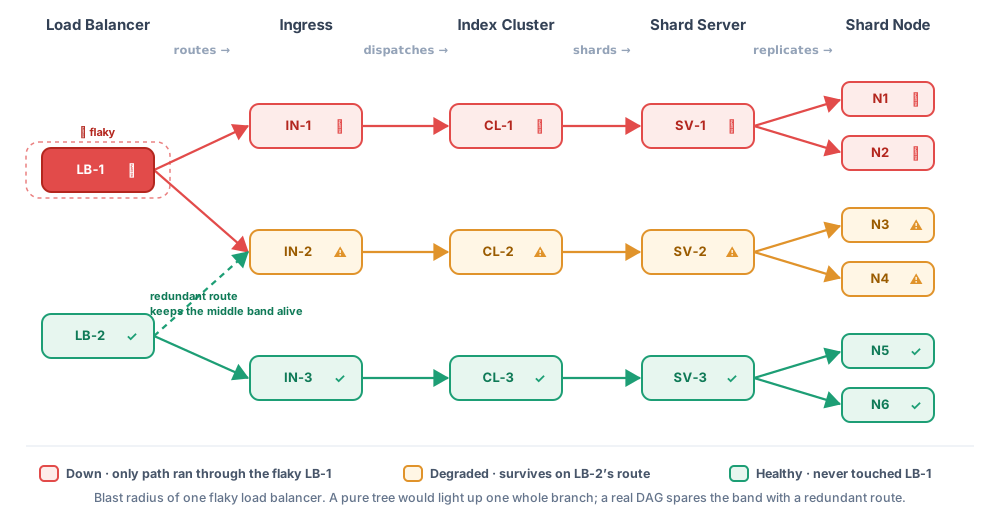
The three bands are the whole story. The red band was reachable only through LB-1, so it goes down with it. The amber band was also reachable from LB-1, but LB-2 still routes to it, so it degrades and stays up. The green band never touches LB-1. A pure tree would just turn one branch red and teach you nothing. The interesting part, the part you cannot eyeball once this graph has thousands of nodes, is which things the redundancy saves.
The dread of graph-queries shows up right behind their promise. A query that like "reads like a sentence" often runs like a Tolstoy novel. So before proposing it to your management you sit down with a red-bull one night and measure.
A note on how these ran. Postgres 19 is not released yet, so ExoBench cannot spin one up for you at exobench.ai the way it does for Postgres 17. These numbers come from ExoBench in local mode, pointed at a PostgreSQL 19beta1 Docker image. This capability will ship as a standalone product in the coming months. Everything here is labeled
19beta1, and GA, expected around September 2026, may shift the plans or the costs.
Fixed-depth Query is a Join wearing arrows
The folklore is that regular databases are fast at joins and graph databases are fast at traversal. It has a real source. The mechanism is called index-free adjacency, and the argument at the center of the O'Reilly Graph Databases book, where a native engine stores direct pointers from each node to its edges, so a hop costs about O(1) while relational joins fall behind as depth grows. Let's see if this model holds up at fixed-depth.
I built the infrastructure as a 3-ary forest, one tree per load balancer, five layers deep, connected by the four typed edges. Load balancer 1's subtree is exactly 81 shard nodes at every scale, so the answer stays fixed while the graph around it grows from 602 thousand rows to 2.4 million. Then I ran the same question two ways: the hand-written 4-join, and the GRAPH_TABLE pattern. First the join.

EXPLAIN ANALYZE
SELECT sn.id AS node_id
FROM load_balancers lb
JOIN routes r      ON r.src = lb.id
JOIN ingresses ig  ON ig.id = r.dst
JOIN dispatches d  ON d.src = ig.id
JOIN clusters cl   ON cl.id = d.dst
JOIN shards s      ON s.src = cl.id
JOIN shard_servers ss ON ss.id = s.dst
JOIN replicates rp ON rp.src = ss.id
JOIN shard_nodes sn ON sn.id = rp.dst
WHERE lb.id = 1
CREATE TABLE load_balancers (id INT PRIMARY KEY);
INSERT INTO load_balancers SELECT gs FROM generate_series(1, ${LBS}) gs;
CREATE TABLE ingresses (id INT PRIMARY KEY);
INSERT INTO ingresses SELECT gs FROM generate_series(1, 3*${LBS}) gs;
CREATE TABLE clusters (id INT PRIMARY KEY);
INSERT INTO clusters SELECT gs FROM generate_series(1, 9*${LBS}) gs;
CREATE TABLE shard_servers (id INT PRIMARY KEY);
INSERT INTO shard_servers SELECT gs FROM generate_series(1, 27*${LBS}) gs;
CREATE TABLE shard_nodes (id INT PRIMARY KEY);
INSERT INTO shard_nodes SELECT gs FROM generate_series(1, 81*${LBS}) gs;
CREATE TABLE routes (id INT PRIMARY KEY, src INT REFERENCES load_balancers(id), dst INT REFERENCES ingresses(id));
INSERT INTO routes SELECT gs, ((gs-1)/3)+1, gs FROM generate_series(1, 3*${LBS}) gs;
CREATE TABLE dispatches (id INT PRIMARY KEY, src INT REFERENCES ingresses(id), dst INT REFERENCES clusters(id));
INSERT INTO dispatches SELECT gs, ((gs-1)/3)+1, gs FROM generate_series(1, 9*${LBS}) gs;
CREATE TABLE shards (id INT PRIMARY KEY, src INT REFERENCES clusters(id), dst INT REFERENCES shard_servers(id));
INSERT INTO shards SELECT gs, ((gs-1)/3)+1, gs FROM generate_series(1, 27*${LBS}) gs;
CREATE TABLE replicates (id INT PRIMARY KEY, src INT REFERENCES shard_servers(id), dst INT REFERENCES shard_nodes(id));
INSERT INTO replicates SELECT gs, ((gs-1)/3)+1, gs FROM generate_series(1, 81*${LBS}) gs;
CREATE INDEX ON routes(src);
CREATE INDEX ON dispatches(src);
CREATE INDEX ON shards(src);
CREATE INDEX ON replicates(src);
CREATE PROPERTY GRAPH infra
VERTEX TABLES (
load_balancers KEY (id) LABEL LoadBalancer PROPERTIES (id),
ingresses KEY (id) LABEL Ingress PROPERTIES (id),
clusters KEY (id) LABEL IndexCluster PROPERTIES (id),
shard_servers KEY (id) LABEL IndexShardServer PROPERTIES (id),
shard_nodes KEY (id) LABEL IndexShardNode PROPERTIES (id)
)
EDGE TABLES (
routes KEY (id) SOURCE KEY (src) REFERENCES load_balancers (id) DESTINATION KEY (dst) REFERENCES ingresses (id) LABEL routes,
dispatches KEY (id) SOURCE KEY (src) REFERENCES ingresses (id) DESTINATION KEY (dst) REFERENCES clusters (id) LABEL dispatches,
shards KEY (id) SOURCE KEY (src) REFERENCES clusters (id) DESTINATION KEY (dst) REFERENCES shard_servers (id) LABEL shards,
replicates KEY (id) SOURCE KEY (src) REFERENCES shard_servers (id) DESTINATION KEY (dst) REFERENCES shard_nodes (id) LABEL replicates
);
VACUUM ANALYZE;| Scale | Time | Plan | Compute |
|---|---|---|---|
| 2.5K | 0.3 ms | The fixed 4-hop typed chain written by hand as a chain of joins across per-type edge tables. PostgreSQL 19beta1 plans it as stacked Nested Loop joins over Index Only Scan and Index Scan, 439 shared buffer hits for 81 result rows. Execution Time 0.252 ms at 2,500 load balancers.QUERY PLAN
Nested Loop (cost=2.84..94.94 rows=81 width=4) (actual time=0.037..0.210 rows=81.00 loops=1)
Buffers: shared hit=439
-> Nested Loop (cost=2.42..58.61 rows=81 width=4) (actual time=0.034..0.126 rows=81.00 loops=1)
Buffers: shared hit=195
-> Nested Loop (cost=2.00..42.64 rows=27 width=8) (actual time=0.030..0.081 rows=27.00 loops=1)
Buffers: shared hit=113
-> Nested Loop (cost=1.71..33.97 rows=27 width=4) (actual time=0.027..0.053 rows=27.00 loops=1)
Buffers: shared hit=58
-> Nested Loop (cost=1.42..29.79 rows=9 width=8) (actual time=0.023..0.038 rows=9.00 loops=1)
Buffers: shared hit=39
-> Nested Loop (cost=1.13..26.94 rows=9 width=4) (actual time=0.020..0.027 rows=9.00 loops=1)
Buffers: shared hit=20
-> Nested Loop (cost=0.84..25.56 rows=3 width=8) (actual time=0.016..0.019 rows=3.00 loops=1)
Buffers: shared hit=13
-> Nested Loop (cost=0.56..12.66 rows=3 width=4) (actual time=0.012..0.013 rows=3.00 loops=1)
Buffers: shared hit=6
-> Index Only Scan using load_balancers_pkey on load_balancers lb (cost=0.28..4.30 rows=1 width=4) (actual time=0.006..0.007 rows=1.00 loops=1)
Index Cond: (id = 1)
Heap Fetches: 0
Index Searches: 1
Buffers: shared hit=3
-> Index Scan using routes_src_idx on routes r (cost=0.28..8.34 rows=3 width=8) (actual time=0.004..0.004 rows=3.00 loops=1)
Index Cond: (src = 1)
Index Searches: 1
Buffers: shared hit=3
-> Index Only Scan using ingresses_pkey on ingresses ig (cost=0.28..4.30 rows=1 width=4) (actual time=0.002..0.002 rows=1.00 loops=3)
Index Cond: (id = r.dst)
Heap Fetches: 0
Index Searches: 3
Buffers: shared hit=7
-> Index Scan using dispatches_src_idx on dispatches d (cost=0.29..0.43 rows=3 width=8) (actual time=0.002..0.002 rows=3.00 loops=3)
Index Cond: (src = ig.id)
Index Searches: 3
Buffers: shared hit=7
-> Index Only Scan using clusters_pkey on clusters cl (cost=0.29..0.32 rows=1 width=4) (actual time=0.001..0.001 rows=1.00 loops=9)
Index Cond: (id = d.dst)
Heap Fetches: 0
Index Searches: 9
Buffers: shared hit=19
-> Index Scan using shards_src_idx on shards s (cost=0.29..0.43 rows=3 width=8) (actual time=0.001..0.001 rows=3.00 loops=9)
Index Cond: (src = cl.id)
Index Searches: 9
Buffers: shared hit=19
-> Index Only Scan using shard_servers_pkey on shard_servers ss (cost=0.29..0.32 rows=1 width=4) (actual time=0.001..0.001 rows=1.00 loops=27)
Index Cond: (id = s.dst)
Heap Fetches: 0
Index Searches: 27
Buffers: shared hit=55
-> Index Scan using replicates_src_idx on replicates rp (cost=0.42..0.56 rows=3 width=8) (actual time=0.001..0.001 rows=3.00 loops=27)
Index Cond: (src = ss.id)
Index Searches: 27
Buffers: shared hit=82
-> Index Only Scan using shard_nodes_pkey on shard_nodes sn (cost=0.42..0.45 rows=1 width=4) (actual time=0.001..0.001 rows=1.00 loops=81)
Index Cond: (id = rp.dst)
Heap Fetches: 0
Index Searches: 81
Buffers: shared hit=244
Planning:
Buffers: shared hit=84
Planning Time: 3.340 ms
Execution Time: 0.252 ms | 2.39s |
| 5K | 0.2 ms | Doubling to 5,000 load balancers changes neither the plan nor its cost: the same Nested Loop stack, the same 439 shared buffer hits, Execution Time 0.241 ms. A fixed-depth chain reads only the rows on the path, so table size does not enter into it.QUERY PLAN
Nested Loop (cost=2.87..95.33 rows=81 width=4) (actual time=0.026..0.207 rows=81.00 loops=1)
Buffers: shared hit=439
-> Nested Loop (cost=2.44..58.80 rows=81 width=4) (actual time=0.023..0.120 rows=81.00 loops=1)
Buffers: shared hit=195
-> Nested Loop (cost=2.02..42.76 rows=27 width=8) (actual time=0.021..0.075 rows=27.00 loops=1)
Buffers: shared hit=113
-> Nested Loop (cost=1.73..34.03 rows=27 width=4) (actual time=0.019..0.048 rows=27.00 loops=1)
Buffers: shared hit=58
-> Nested Loop (cost=1.43..29.83 rows=9 width=8) (actual time=0.016..0.032 rows=9.00 loops=1)
Buffers: shared hit=39
-> Nested Loop (cost=1.14..26.96 rows=9 width=4) (actual time=0.014..0.022 rows=9.00 loops=1)
Buffers: shared hit=20
-> Nested Loop (cost=0.85..25.58 rows=3 width=8) (actual time=0.012..0.016 rows=3.00 loops=1)
Buffers: shared hit=13
-> Nested Loop (cost=0.57..12.67 rows=3 width=4) (actual time=0.010..0.011 rows=3.00 loops=1)
Buffers: shared hit=6
-> Index Only Scan using load_balancers_pkey on load_balancers lb (cost=0.28..4.30 rows=1 width=4) (actual time=0.005..0.005 rows=1.00 loops=1)
Index Cond: (id = 1)
Heap Fetches: 0
Index Searches: 1
Buffers: shared hit=3
-> Index Scan using routes_src_idx on routes r (cost=0.29..8.34 rows=3 width=8) (actual time=0.004..0.004 rows=3.00 loops=1)
Index Cond: (src = 1)
Index Searches: 1
Buffers: shared hit=3
-> Index Only Scan using ingresses_pkey on ingresses ig (cost=0.29..4.30 rows=1 width=4) (actual time=0.001..0.001 rows=1.00 loops=3)
Index Cond: (id = r.dst)
Heap Fetches: 0
Index Searches: 3
Buffers: shared hit=7
-> Index Scan using dispatches_src_idx on dispatches d (cost=0.29..0.43 rows=3 width=8) (actual time=0.001..0.002 rows=3.00 loops=3)
Index Cond: (src = ig.id)
Index Searches: 3
Buffers: shared hit=7
-> Index Only Scan using clusters_pkey on clusters cl (cost=0.29..0.32 rows=1 width=4) (actual time=0.001..0.001 rows=1.00 loops=9)
Index Cond: (id = d.dst)
Heap Fetches: 0
Index Searches: 9
Buffers: shared hit=19
-> Index Scan using shards_src_idx on shards s (cost=0.29..0.44 rows=3 width=8) (actual time=0.001..0.001 rows=3.00 loops=9)
Index Cond: (src = cl.id)
Index Searches: 9
Buffers: shared hit=19
-> Index Only Scan using shard_servers_pkey on shard_servers ss (cost=0.29..0.32 rows=1 width=4) (actual time=0.001..0.001 rows=1.00 loops=27)
Index Cond: (id = s.dst)
Heap Fetches: 0
Index Searches: 27
Buffers: shared hit=55
-> Index Scan using replicates_src_idx on replicates rp (cost=0.42..0.56 rows=3 width=8) (actual time=0.001..0.001 rows=3.00 loops=27)
Index Cond: (src = ss.id)
Index Searches: 27
Buffers: shared hit=82
-> Index Only Scan using shard_nodes_pkey on shard_nodes sn (cost=0.42..0.45 rows=1 width=4) (actual time=0.001..0.001 rows=1.00 loops=81)
Index Cond: (id = rp.dst)
Heap Fetches: 0
Index Searches: 81
Buffers: shared hit=244
Planning:
Buffers: shared hit=84
Planning Time: 2.426 ms
Execution Time: 0.241 ms | 4.82s |
| 10K | 0.3 ms | At 10,000 load balancers the hand-written join is still Nested Loop over Index Only Scan and Index Scan, 475 shared buffer hits, Execution Time 0.264 ms. Flat from 2,500 to 10,000 because B-tree depth, not row count, sets the work.QUERY PLAN
Nested Loop (cost=3.14..100.23 rows=81 width=4) (actual time=0.035..0.218 rows=81.00 loops=1)
Buffers: shared hit=475
-> Nested Loop (cost=2.71..63.50 rows=81 width=4) (actual time=0.031..0.131 rows=81.00 loops=1)
Buffers: shared hit=231
-> Nested Loop (cost=2.29..47.39 rows=27 width=8) (actual time=0.028..0.085 rows=27.00 loops=1)
Buffers: shared hit=149
-> Nested Loop (cost=1.87..35.22 rows=27 width=4) (actual time=0.025..0.054 rows=27.00 loops=1)
Buffers: shared hit=67
-> Nested Loop (cost=1.44..29.87 rows=9 width=8) (actual time=0.021..0.037 rows=9.00 loops=1)
Buffers: shared hit=39
-> Nested Loop (cost=1.15..26.98 rows=9 width=4) (actual time=0.018..0.026 rows=9.00 loops=1)
Buffers: shared hit=20
-> Nested Loop (cost=0.86..25.59 rows=3 width=8) (actual time=0.015..0.019 rows=3.00 loops=1)
Buffers: shared hit=13
-> Nested Loop (cost=0.57..12.67 rows=3 width=4) (actual time=0.011..0.013 rows=3.00 loops=1)
Buffers: shared hit=6
-> Index Only Scan using load_balancers_pkey on load_balancers lb (cost=0.29..4.30 rows=1 width=4) (actual time=0.005..0.006 rows=1.00 loops=1)
Index Cond: (id = 1)
Heap Fetches: 0
Index Searches: 1
Buffers: shared hit=3
-> Index Scan using routes_src_idx on routes r (cost=0.29..8.34 rows=3 width=8) (actual time=0.005..0.005 rows=3.00 loops=1)
Index Cond: (src = 1)
Index Searches: 1
Buffers: shared hit=3
-> Index Only Scan using ingresses_pkey on ingresses ig (cost=0.29..4.30 rows=1 width=4) (actual time=0.001..0.001 rows=1.00 loops=3)
Index Cond: (id = r.dst)
Heap Fetches: 0
Index Searches: 3
Buffers: shared hit=7
-> Index Scan using dispatches_src_idx on dispatches d (cost=0.29..0.43 rows=3 width=8) (actual time=0.002..0.002 rows=3.00 loops=3)
Index Cond: (src = ig.id)
Index Searches: 3
Buffers: shared hit=7
-> Index Only Scan using clusters_pkey on clusters cl (cost=0.29..0.32 rows=1 width=4) (actual time=0.001..0.001 rows=1.00 loops=9)
Index Cond: (id = d.dst)
Heap Fetches: 0
Index Searches: 9
Buffers: shared hit=19
-> Index Scan using shards_src_idx on shards s (cost=0.42..0.56 rows=3 width=8) (actual time=0.001..0.002 rows=3.00 loops=9)
Index Cond: (src = cl.id)
Index Searches: 9
Buffers: shared hit=28
-> Index Only Scan using shard_servers_pkey on shard_servers ss (cost=0.42..0.45 rows=1 width=4) (actual time=0.001..0.001 rows=1.00 loops=27)
Index Cond: (id = s.dst)
Heap Fetches: 0
Index Searches: 27
Buffers: shared hit=82
-> Index Scan using replicates_src_idx on replicates rp (cost=0.42..0.57 rows=3 width=8) (actual time=0.001..0.001 rows=3.00 loops=27)
Index Cond: (src = ss.id)
Index Searches: 27
Buffers: shared hit=82
-> Index Only Scan using shard_nodes_pkey on shard_nodes sn (cost=0.42..0.45 rows=1 width=4) (actual time=0.001..0.001 rows=1.00 loops=81)
Index Cond: (id = rp.dst)
Heap Fetches: 0
Index Searches: 81
Buffers: shared hit=244
Planning:
Buffers: shared hit=92
Planning Time: 2.965 ms
Execution Time: 0.264 ms | 9.37s |
Nested-loop index-scan chain, driven from the one anchor row, index-only scans the whole way down. Now the graph query for the same answer.
EXPLAIN ANALYZE
SELECT node_id
FROM GRAPH_TABLE (infra
  MATCH (lb IS LoadBalancer WHERE lb.id = 1)
        -[IS routes]->(ig IS Ingress)
        -[IS dispatches]->(cl IS IndexCluster)
        -[IS shards]->(ss IS IndexShardServer)
        -[IS replicates]->(sn IS IndexShardNode)
  COLUMNS (sn.id AS node_id)
)
CREATE TABLE load_balancers (id INT PRIMARY KEY);
INSERT INTO load_balancers SELECT gs FROM generate_series(1, ${LBS}) gs;
CREATE TABLE ingresses (id INT PRIMARY KEY);
INSERT INTO ingresses SELECT gs FROM generate_series(1, 3*${LBS}) gs;
CREATE TABLE clusters (id INT PRIMARY KEY);
INSERT INTO clusters SELECT gs FROM generate_series(1, 9*${LBS}) gs;
CREATE TABLE shard_servers (id INT PRIMARY KEY);
INSERT INTO shard_servers SELECT gs FROM generate_series(1, 27*${LBS}) gs;
CREATE TABLE shard_nodes (id INT PRIMARY KEY);
INSERT INTO shard_nodes SELECT gs FROM generate_series(1, 81*${LBS}) gs;
CREATE TABLE routes (id INT PRIMARY KEY, src INT REFERENCES load_balancers(id), dst INT REFERENCES ingresses(id));
INSERT INTO routes SELECT gs, ((gs-1)/3)+1, gs FROM generate_series(1, 3*${LBS}) gs;
CREATE TABLE dispatches (id INT PRIMARY KEY, src INT REFERENCES ingresses(id), dst INT REFERENCES clusters(id));
INSERT INTO dispatches SELECT gs, ((gs-1)/3)+1, gs FROM generate_series(1, 9*${LBS}) gs;
CREATE TABLE shards (id INT PRIMARY KEY, src INT REFERENCES clusters(id), dst INT REFERENCES shard_servers(id));
INSERT INTO shards SELECT gs, ((gs-1)/3)+1, gs FROM generate_series(1, 27*${LBS}) gs;
CREATE TABLE replicates (id INT PRIMARY KEY, src INT REFERENCES shard_servers(id), dst INT REFERENCES shard_nodes(id));
INSERT INTO replicates SELECT gs, ((gs-1)/3)+1, gs FROM generate_series(1, 81*${LBS}) gs;
CREATE INDEX ON routes(src);
CREATE INDEX ON dispatches(src);
CREATE INDEX ON shards(src);
CREATE INDEX ON replicates(src);
CREATE PROPERTY GRAPH infra
VERTEX TABLES (
load_balancers KEY (id) LABEL LoadBalancer PROPERTIES (id),
ingresses KEY (id) LABEL Ingress PROPERTIES (id),
clusters KEY (id) LABEL IndexCluster PROPERTIES (id),
shard_servers KEY (id) LABEL IndexShardServer PROPERTIES (id),
shard_nodes KEY (id) LABEL IndexShardNode PROPERTIES (id)
)
EDGE TABLES (
routes KEY (id) SOURCE KEY (src) REFERENCES load_balancers (id) DESTINATION KEY (dst) REFERENCES ingresses (id) LABEL routes,
dispatches KEY (id) SOURCE KEY (src) REFERENCES ingresses (id) DESTINATION KEY (dst) REFERENCES clusters (id) LABEL dispatches,
shards KEY (id) SOURCE KEY (src) REFERENCES clusters (id) DESTINATION KEY (dst) REFERENCES shard_servers (id) LABEL shards,
replicates KEY (id) SOURCE KEY (src) REFERENCES shard_servers (id) DESTINATION KEY (dst) REFERENCES shard_nodes (id) LABEL replicates
);
VACUUM ANALYZE;| Scale | Time | Plan | Compute |
|---|---|---|---|
| 2.5K | 0.5 ms | The same 4-hop traversal written as SQL/PGQ, GRAPH_TABLE (infra MATCH ...) on PostgreSQL 19beta1. The plan and its cost are identical to the hand-written join, Nested Loop over Index Only Scan and Index Scan with 439 shared hits, because GRAPH_TABLE rewrites into that join. Execution Time 0.479 ms at 2,500 load balancers.QUERY PLAN
Nested Loop (cost=2.84..94.94 rows=81 width=4) (actual time=0.066..0.410 rows=81.00 loops=1)
Buffers: shared hit=439
-> Nested Loop (cost=2.42..58.61 rows=81 width=4) (actual time=0.058..0.236 rows=81.00 loops=1)
Buffers: shared hit=195
-> Nested Loop (cost=2.00..42.64 rows=27 width=8) (actual time=0.052..0.154 rows=27.00 loops=1)
Buffers: shared hit=113
-> Nested Loop (cost=1.71..33.97 rows=27 width=4) (actual time=0.047..0.103 rows=27.00 loops=1)
Buffers: shared hit=58
-> Nested Loop (cost=1.42..29.79 rows=9 width=8) (actual time=0.041..0.072 rows=9.00 loops=1)
Buffers: shared hit=39
-> Nested Loop (cost=1.13..26.94 rows=9 width=4) (actual time=0.035..0.051 rows=9.00 loops=1)
Buffers: shared hit=20
-> Nested Loop (cost=0.84..25.56 rows=3 width=8) (actual time=0.030..0.038 rows=3.00 loops=1)
Buffers: shared hit=13
-> Nested Loop (cost=0.56..12.66 rows=3 width=4) (actual time=0.024..0.027 rows=3.00 loops=1)
Buffers: shared hit=6
-> Index Only Scan using load_balancers_pkey on load_balancers (cost=0.28..4.30 rows=1 width=4) (actual time=0.016..0.017 rows=1.00 loops=1)
Index Cond: (id = 1)
Heap Fetches: 0
Index Searches: 1
Buffers: shared hit=3
-> Index Scan using routes_src_idx on routes (cost=0.28..8.34 rows=3 width=8) (actual time=0.006..0.007 rows=3.00 loops=1)
Index Cond: (src = 1)
Index Searches: 1
Buffers: shared hit=3
-> Index Only Scan using ingresses_pkey on ingresses (cost=0.28..4.30 rows=1 width=4) (actual time=0.002..0.002 rows=1.00 loops=3)
Index Cond: (id = routes.dst)
Heap Fetches: 0
Index Searches: 3
Buffers: shared hit=7
-> Index Scan using dispatches_src_idx on dispatches (cost=0.29..0.43 rows=3 width=8) (actual time=0.003..0.003 rows=3.00 loops=3)
Index Cond: (src = ingresses.id)
Index Searches: 3
Buffers: shared hit=7
-> Index Only Scan using clusters_pkey on clusters (cost=0.29..0.32 rows=1 width=4) (actual time=0.002..0.002 rows=1.00 loops=9)
Index Cond: (id = dispatches.dst)
Heap Fetches: 0
Index Searches: 9
Buffers: shared hit=19
-> Index Scan using shards_src_idx on shards (cost=0.29..0.43 rows=3 width=8) (actual time=0.002..0.003 rows=3.00 loops=9)
Index Cond: (src = clusters.id)
Index Searches: 9
Buffers: shared hit=19
-> Index Only Scan using shard_servers_pkey on shard_servers (cost=0.29..0.32 rows=1 width=4) (actual time=0.001..0.001 rows=1.00 loops=27)
Index Cond: (id = shards.dst)
Heap Fetches: 0
Index Searches: 27
Buffers: shared hit=55
-> Index Scan using replicates_src_idx on replicates (cost=0.42..0.56 rows=3 width=8) (actual time=0.002..0.002 rows=3.00 loops=27)
Index Cond: (src = shard_servers.id)
Index Searches: 27
Buffers: shared hit=82
-> Index Only Scan using shard_nodes_pkey on shard_nodes (cost=0.42..0.45 rows=1 width=4) (actual time=0.002..0.002 rows=1.00 loops=81)
Index Cond: (id = replicates.dst)
Heap Fetches: 0
Index Searches: 81
Buffers: shared hit=244
Planning:
Buffers: shared hit=84
Planning Time: 5.436 ms
Execution Time: 0.479 ms | 2.40s |
| 5K | 0.3 ms | GRAPH_TABLE at 5,000 load balancers: the same Nested Loop plan, 439 shared hits, Execution Time 0.266 ms against 0.241 ms for the hand-written join. Planning Time 5.649 ms against 2.426 ms is the one consistent difference between the two forms.QUERY PLAN
Nested Loop (cost=2.87..95.33 rows=81 width=4) (actual time=0.046..0.221 rows=81.00 loops=1)
Buffers: shared hit=439
-> Nested Loop (cost=2.44..58.80 rows=81 width=4) (actual time=0.041..0.133 rows=81.00 loops=1)
Buffers: shared hit=195
-> Nested Loop (cost=2.02..42.76 rows=27 width=8) (actual time=0.037..0.088 rows=27.00 loops=1)
Buffers: shared hit=113
-> Nested Loop (cost=1.73..34.03 rows=27 width=4) (actual time=0.033..0.061 rows=27.00 loops=1)
Buffers: shared hit=58
-> Nested Loop (cost=1.43..29.83 rows=9 width=8) (actual time=0.030..0.045 rows=9.00 loops=1)
Buffers: shared hit=39
-> Nested Loop (cost=1.14..26.96 rows=9 width=4) (actual time=0.027..0.034 rows=9.00 loops=1)
Buffers: shared hit=20
-> Nested Loop (cost=0.85..25.58 rows=3 width=8) (actual time=0.022..0.026 rows=3.00 loops=1)
Buffers: shared hit=13
-> Nested Loop (cost=0.57..12.67 rows=3 width=4) (actual time=0.019..0.020 rows=3.00 loops=1)
Buffers: shared hit=6
-> Index Only Scan using load_balancers_pkey on load_balancers (cost=0.28..4.30 rows=1 width=4) (actual time=0.012..0.013 rows=1.00 loops=1)
Index Cond: (id = 1)
Heap Fetches: 0
Index Searches: 1
Buffers: shared hit=3
-> Index Scan using routes_src_idx on routes (cost=0.29..8.34 rows=3 width=8) (actual time=0.004..0.005 rows=3.00 loops=1)
Index Cond: (src = 1)
Index Searches: 1
Buffers: shared hit=3
-> Index Only Scan using ingresses_pkey on ingresses (cost=0.29..4.30 rows=1 width=4) (actual time=0.001..0.001 rows=1.00 loops=3)
Index Cond: (id = routes.dst)
Heap Fetches: 0
Index Searches: 3
Buffers: shared hit=7
-> Index Scan using dispatches_src_idx on dispatches (cost=0.29..0.43 rows=3 width=8) (actual time=0.002..0.002 rows=3.00 loops=3)
Index Cond: (src = ingresses.id)
Index Searches: 3
Buffers: shared hit=7
-> Index Only Scan using clusters_pkey on clusters (cost=0.29..0.32 rows=1 width=4) (actual time=0.001..0.001 rows=1.00 loops=9)
Index Cond: (id = dispatches.dst)
Heap Fetches: 0
Index Searches: 9
Buffers: shared hit=19
-> Index Scan using shards_src_idx on shards (cost=0.29..0.44 rows=3 width=8) (actual time=0.001..0.001 rows=3.00 loops=9)
Index Cond: (src = clusters.id)
Index Searches: 9
Buffers: shared hit=19
-> Index Only Scan using shard_servers_pkey on shard_servers (cost=0.29..0.32 rows=1 width=4) (actual time=0.001..0.001 rows=1.00 loops=27)
Index Cond: (id = shards.dst)
Heap Fetches: 0
Index Searches: 27
Buffers: shared hit=55
-> Index Scan using replicates_src_idx on replicates (cost=0.42..0.56 rows=3 width=8) (actual time=0.001..0.001 rows=3.00 loops=27)
Index Cond: (src = shard_servers.id)
Index Searches: 27
Buffers: shared hit=82
-> Index Only Scan using shard_nodes_pkey on shard_nodes (cost=0.42..0.45 rows=1 width=4) (actual time=0.001..0.001 rows=1.00 loops=81)
Index Cond: (id = replicates.dst)
Heap Fetches: 0
Index Searches: 81
Buffers: shared hit=244
Planning:
Buffers: shared hit=84
Planning Time: 5.649 ms
Execution Time: 0.266 ms | 4.62s |
| 10K | 0.3 ms | GRAPH_TABLE at 10,000 load balancers, Execution Time 0.287 ms against 0.264 ms for the join, same Nested Loop plan over 475 shared hits. Planning Time 7.145 ms is where the pattern-matching syntax costs something on PostgreSQL 19beta1.QUERY PLAN
Nested Loop (cost=3.14..100.23 rows=81 width=4) (actual time=0.049..0.239 rows=81.00 loops=1)
Buffers: shared hit=475
-> Nested Loop (cost=2.71..63.50 rows=81 width=4) (actual time=0.044..0.148 rows=81.00 loops=1)
Buffers: shared hit=231
-> Nested Loop (cost=2.29..47.39 rows=27 width=8) (actual time=0.040..0.101 rows=27.00 loops=1)
Buffers: shared hit=149
-> Nested Loop (cost=1.87..35.22 rows=27 width=4) (actual time=0.035..0.067 rows=27.00 loops=1)
Buffers: shared hit=67
-> Nested Loop (cost=1.44..29.87 rows=9 width=8) (actual time=0.031..0.048 rows=9.00 loops=1)
Buffers: shared hit=39
-> Nested Loop (cost=1.15..26.98 rows=9 width=4) (actual time=0.027..0.036 rows=9.00 loops=1)
Buffers: shared hit=20
-> Nested Loop (cost=0.86..25.59 rows=3 width=8) (actual time=0.024..0.028 rows=3.00 loops=1)
Buffers: shared hit=13
-> Nested Loop (cost=0.57..12.67 rows=3 width=4) (actual time=0.019..0.020 rows=3.00 loops=1)
Buffers: shared hit=6
-> Index Only Scan using load_balancers_pkey on load_balancers (cost=0.29..4.30 rows=1 width=4) (actual time=0.013..0.014 rows=1.00 loops=1)
Index Cond: (id = 1)
Heap Fetches: 0
Index Searches: 1
Buffers: shared hit=3
-> Index Scan using routes_src_idx on routes (cost=0.29..8.34 rows=3 width=8) (actual time=0.004..0.005 rows=3.00 loops=1)
Index Cond: (src = 1)
Index Searches: 1
Buffers: shared hit=3
-> Index Only Scan using ingresses_pkey on ingresses (cost=0.29..4.30 rows=1 width=4) (actual time=0.002..0.002 rows=1.00 loops=3)
Index Cond: (id = routes.dst)
Heap Fetches: 0
Index Searches: 3
Buffers: shared hit=7
-> Index Scan using dispatches_src_idx on dispatches (cost=0.29..0.43 rows=3 width=8) (actual time=0.002..0.002 rows=3.00 loops=3)
Index Cond: (src = ingresses.id)
Index Searches: 3
Buffers: shared hit=7
-> Index Only Scan using clusters_pkey on clusters (cost=0.29..0.32 rows=1 width=4) (actual time=0.001..0.001 rows=1.00 loops=9)
Index Cond: (id = dispatches.dst)
Heap Fetches: 0
Index Searches: 9
Buffers: shared hit=19
-> Index Scan using shards_src_idx on shards (cost=0.42..0.56 rows=3 width=8) (actual time=0.001..0.002 rows=3.00 loops=9)
Index Cond: (src = clusters.id)
Index Searches: 9
Buffers: shared hit=28
-> Index Only Scan using shard_servers_pkey on shard_servers (cost=0.42..0.45 rows=1 width=4) (actual time=0.001..0.001 rows=1.00 loops=27)
Index Cond: (id = shards.dst)
Heap Fetches: 0
Index Searches: 27
Buffers: shared hit=82
-> Index Scan using replicates_src_idx on replicates (cost=0.42..0.57 rows=3 width=8) (actual time=0.001..0.001 rows=3.00 loops=27)
Index Cond: (src = shard_servers.id)
Index Searches: 27
Buffers: shared hit=82
-> Index Only Scan using shard_nodes_pkey on shard_nodes (cost=0.42..0.45 rows=1 width=4) (actual time=0.001..0.001 rows=1.00 loops=81)
Index Cond: (id = replicates.dst)
Heap Fetches: 0
Index Searches: 81
Buffers: shared hit=244
Planning:
Buffers: shared hit=92
Planning Time: 7.145 ms
Execution Time: 0.287 ms | 9.17s |
Open both plans and diff them. Same nested loops, same index-only scans on the vertex tables, same buffer counts, cosmetic naming aside. I also proved the results identical, EXCEPT in both directions returns zero rows. The graph query did not run a graph engine. It ran the join, because that is what it compiled to.
The line is flat. Execution time sits under half a millisecond, and stays there while the graph grows fourfold, because a selective fixed-depth traversal touches only the anchor's subtree through indexes and never sees the rest of the graph. The graph syntax and the join track each other, because one is the other. SQL/PGQ's first run is a hair higher because of planning jitter.
Christophe Pettus of PGX, who has been close to this feature, put the mechanism plainly:
"The implementation is deliberately not a graph storage engine. It is a rewriter: a property graph is metadata that maps existing relational tables into the vertex/edge abstraction, and a graph pattern in
GRAPH_TABLEis rewritten into a tree of relational joins and filters that the planner then handles using its existing machinery."
And, more bluntly: "A graph traversal of depth N becomes N joins."
So at fixed depth the Graph vs Joins argument is moot. What SQL/PGQ buys here is legibility, i.e. arrows over a chain of ON clauses. Postgres is already good at indexed joins, so you pay essentially nothing for the readability. It's a genuinely nice thing but says nothing about confirming or denying our folklore.
The cliff: Variable Depth
Let's try to get closer to the juicy contention. Not "find the shard nodes exactly four hops down," but "given this flaky node, what is downstream at any depth" i.e. unknown hop count. This is called blast radius, and it is where a real graph engine is supposed to earn its keep.
The graph-query standard has syntax for it, the variable-length quantifier. You would write -[e]->{1,3} for one to three hops, or -[e]->{1,} for one-or-more, unbounded. So I wrote the unbounded form against a small tree and asked PG19 for everything reachable from node 1.
SELECT b_id
FROM GRAPH_TABLE (g
  MATCH (a IS node WHERE a.id = 1)-[IS link]->{1,}(b IS node)
  COLUMNS (b.id AS b_id)
)
CREATE TABLE node (id INT PRIMARY KEY);
INSERT INTO node SELECT i FROM generate_series(1,15) i;
CREATE TABLE edge (id SERIAL PRIMARY KEY, src INT REFERENCES node(id), dst INT REFERENCES node(id));
INSERT INTO edge (src, dst)
SELECT i, 2*i FROM generate_series(1,15) i WHERE 2*i<=15
UNION ALL SELECT i, 2*i+1 FROM generate_series(1,15) i WHERE 2*i+1<=15;
CREATE PROPERTY GRAPH g
VERTEX TABLES ( node KEY (id) LABEL node PROPERTIES (id) )
EDGE TABLES ( edge KEY (id) SOURCE KEY (src) REFERENCES node(id) DESTINATION KEY (dst) REFERENCES node(id) LABEL link );The unbounded quantifier -[IS link]->{1,} does not survive the parser. PostgreSQL 19beta1 answers 'syntax error at or near }' at position 82, so variable-depth SQL/PGQ traversal is not reachable in this beta by syntax alone.
SELECT b_id
FROM GRAPH_TABLE (g
  MATCH (a IS node WHERE a.id = 1)-[IS link]->{1,}(b IS node)
  COLUMNS (b.id AS b_id)
)Syntax error at the brace. The grammar rejects the open-ended form outright. Fine, maybe the bounded form fares better.
SELECT b_id
FROM GRAPH_TABLE (g
  MATCH (a IS node WHERE a.id = 1)-[IS link]->{1,10}(b IS node)
  COLUMNS (b.id AS b_id)
)
CREATE TABLE node (id INT PRIMARY KEY);
INSERT INTO node SELECT i FROM generate_series(1,15) i;
CREATE TABLE edge (id SERIAL PRIMARY KEY, src INT REFERENCES node(id), dst INT REFERENCES node(id));
INSERT INTO edge (src, dst)
SELECT i, 2*i FROM generate_series(1,15) i WHERE 2*i<=15
UNION ALL SELECT i, 2*i+1 FROM generate_series(1,15) i WHERE 2*i+1<=15;
CREATE PROPERTY GRAPH g
VERTEX TABLES ( node KEY (id) LABEL node PROPERTIES (id) )
EDGE TABLES ( edge KEY (id) SOURCE KEY (src) REFERENCES node(id) DESTINATION KEY (dst) REFERENCES node(id) LABEL link );Bounding the quantifier to {1,10} gets past the parser and fails one step later with 'element pattern quantifier is not supported'. PostgreSQL 19beta1 implements fixed-length GRAPH_TABLE patterns only, so a blast radius query still needs a recursive CTE.
SELECT b_id
FROM GRAPH_TABLE (g
  MATCH (a IS node WHERE a.id = 1)-[IS link]->{1,10}(b IS node)
  COLUMNS (b.id AS b_id)
)element pattern quantifier is not supported. The bounded form parses and then hits a wall. That is Postgres 19beta1 itself refusing the pattern, and it's the reason I almost stopped writing this post. Anything with an unknown hop count cannot use SQL/PGQ on this Postgres build. Pettus says the same, and says it is deliberate: the PG19 implementation "explicitly does not support quantified patterns," and "variable-length paths are planned for a future release."
So the tool for variable depth, today, is the one it has always been, the recursive CTE.
What the future quantifier will probably do. When
{X,Y}lands, do not expect it to conjure index-free adjacency. SQL/PGQ is a rewriter, and Postgres has exactly one way to walk its storage to an unknown depth: a recursive plan over indexed tables. It has no node-to-edge pointers to chase. Pettus expects the same, on the record: for variable-depth traversals, "the rewrite would be doing what your recursive CTEs already do, with similar performance." The prediction, then, is a readability win over the hand-written CTE at roughly the same speed, exactly as fixed-depth SQL/PGQ was a readability win over the hand-written join. I could not benchmark the quantifier, because it does not run. I could benchmark the thing it will compile down to.
Here is the recursive CTE for blast radius, walking a binary impact tree where the whole tree is reachable from the root, so the blast radius equals the node count:
WITH RECURSIVE reach AS (
  SELECT dst AS node_id FROM edges WHERE src = 1
  UNION
  SELECT e.dst FROM edges e JOIN reach r ON e.src = r.node_id
)
SELECT count(*) FROM reach;UNION, not UNION ALL, so it dedups the frontier and terminates even if the graph has cycles. I ran it across a reachable set from 32,766 up to 1,048,574 nodes, which is 14 to 19 hops deep.
EXPLAIN ANALYZE
WITH RECURSIVE reach AS (
  SELECT dst AS b_id FROM edges WHERE src = 1
  UNION
  SELECT e.dst FROM edges e JOIN reach r ON e.src = r.b_id
)
SELECT count(*) FROM reach
CREATE TABLE nodes (id INT PRIMARY KEY);
INSERT INTO nodes SELECT i FROM generate_series(1, ${NODES}) i;
CREATE TABLE edges (id SERIAL PRIMARY KEY, src INT REFERENCES nodes(id), dst INT REFERENCES nodes(id));
INSERT INTO edges (src, dst)
SELECT i, 2*i FROM generate_series(1, ${NODES}) i WHERE 2*i <= ${NODES}
UNION ALL
SELECT i, 2*i+1 FROM generate_series(1, ${NODES}) i WHERE 2*i+1 <= ${NODES};
CREATE INDEX ON edges(src);
CREATE PROPERTY GRAPH g
VERTEX TABLES ( nodes KEY (id) LABEL node PROPERTIES (id) )
EDGE TABLES ( edges KEY (id) SOURCE KEY (src) REFERENCES nodes(id) DESTINATION KEY (dst) REFERENCES nodes(id) LABEL edge );
VACUUM ANALYZE;| Scale | Time | Plan | Compute |
|---|---|---|---|
| 32.8K | 59.1 ms | Blast radius as a plain WITH RECURSIVE CTE over an edges table. Recursive Union driving Index Scan on edges_src_idx inside a Nested Loop, worktable Storage: Memory at 1,153kB, 98,300 shared buffer hits to reach 32,766 nodes. Execution Time 59.147 ms.QUERY PLAN
Aggregate (cost=2085.10..2085.11 rows=1 width=8) (actual time=58.902..58.904 rows=1.00 loops=1)
Buffers: shared hit=98300
CTE reach
-> Recursive Union (cost=0.29..2076.05 rows=402 width=4) (actual time=0.011..52.107 rows=32766.00 loops=1)
Storage: Memory Maximum Storage: 1153kB
Buffers: shared hit=98300
-> Index Scan using edges_src_idx on edges (cost=0.29..11.31 rows=2 width=4) (actual time=0.010..0.012 rows=2.00 loops=1)
Index Cond: (src = 1)
Index Searches: 1
Buffers: shared hit=4
-> Nested Loop (cost=0.29..206.07 rows=40 width=4) (actual time=0.895..2.985 rows=2340.29 loops=14)
Buffers: shared hit=98296
-> WorkTable Scan on reach r (cost=0.00..0.40 rows=20 width=4) (actual time=0.000..0.079 rows=2340.43 loops=14)
-> Index Scan using edges_src_idx on edges e (cost=0.29..10.26 rows=2 width=8) (actual time=0.001..0.001 rows=1.00 loops=32766)
Index Cond: (src = r.b_id)
Index Searches: 32766
Buffers: shared hit=98296
-> CTE Scan on reach (cost=0.00..8.04 rows=402 width=0) (actual time=0.011..57.410 rows=32766.00 loops=1)
Storage: Memory Maximum Storage: 1280kB
Buffers: shared hit=98300
Planning Time: 0.174 ms
Execution Time: 59.147 ms | 0.55s |
| 131.1K | 299 ms | At 131,070 reachable nodes the recursive worktable still fits in memory at 4,404kB but starts writing 223 temp blocks, 524,283 shared hits, Execution Time 298.997 ms. Roughly linear in the size of the reachable set.QUERY PLAN
Aggregate (cost=2291.88..2291.89 rows=1 width=8) (actual time=296.761..296.764 rows=1.00 loops=1)
Buffers: shared hit=524283, temp written=223
CTE reach
-> Recursive Union (cost=0.42..2282.83 rows=402 width=4) (actual time=0.013..263.496 rows=131070.00 loops=1)
Storage: Memory Maximum Storage: 4404kB
Buffers: shared hit=524283
-> Index Scan using edges_src_idx on edges (cost=0.42..11.45 rows=2 width=4) (actual time=0.011..0.014 rows=2.00 loops=1)
Index Cond: (src = 1)
Index Searches: 1
Buffers: shared hit=5
-> Nested Loop (cost=0.42..226.74 rows=40 width=4) (actual time=5.057..13.536 rows=8191.75 loops=16)
Buffers: shared hit=524278
-> WorkTable Scan on reach r (cost=0.00..0.40 rows=20 width=4) (actual time=0.000..0.391 rows=8191.88 loops=16)
-> Index Scan using edges_src_idx on edges e (cost=0.42..11.30 rows=2 width=8) (actual time=0.001..0.001 rows=1.00 loops=131070)
Index Cond: (src = r.b_id)
Index Searches: 131070
Buffers: shared hit=524278
-> CTE Scan on reach (cost=0.00..8.04 rows=402 width=0) (actual time=0.013..290.714 rows=131070.00 loops=1)
Storage: Disk Maximum Storage: 4096kB
Buffers: shared hit=524283, temp written=223
Planning Time: 0.117 ms
Execution Time: 298.997 ms | 2.13s |
| 524.3K | 1.2s | At 524,286 nodes the worktable switches to Storage: Disk at 8,192kB with temp read 672 and written 1,567 blocks, 2,097,147 shared hits, Execution Time 1156.342 ms. The spill is where the curve starts to bend.QUERY PLAN
Aggregate (cost=2329.80..2329.81 rows=1 width=8) (actual time=1151.308..1151.310 rows=1.00 loops=1)
Buffers: shared hit=2097147, temp read=672 written=1567
CTE reach
-> Recursive Union (cost=0.42..2321.21 rows=382 width=4) (actual time=0.013..1018.319 rows=524286.00 loops=1)
Storage: Disk Maximum Storage: 8192kB
Buffers: shared hit=2097147, temp read=672 written=672
-> Index Scan using edges_src_idx on edges (cost=0.42..11.49 rows=2 width=4) (actual time=0.011..0.014 rows=2.00 loops=1)
Index Cond: (src = 1)
Index Searches: 1
Buffers: shared hit=5
-> Nested Loop (cost=0.42..230.59 rows=38 width=4) (actual time=15.622..45.184 rows=29126.89 loops=18)
Buffers: shared hit=2097142, temp read=672 written=2
-> WorkTable Scan on reach r (cost=0.00..0.40 rows=20 width=4) (actual time=0.001..2.043 rows=29127.00 loops=18)
Buffers: temp read=672 written=2
-> Index Scan using edges_src_idx on edges e (cost=0.42..11.49 rows=2 width=8) (actual time=0.001..0.001 rows=1.00 loops=524286)
Index Cond: (src = r.b_id)
Index Searches: 524286
Buffers: shared hit=2097142
-> CTE Scan on reach (cost=0.00..7.64 rows=382 width=0) (actual time=0.013..1125.722 rows=524286.00 loops=1)
Storage: Disk Maximum Storage: 7160kB
Buffers: shared hit=2097147, temp read=672 written=1567
Planning Time: 0.122 ms
Execution Time: 1156.342 ms | 7.78s |
| 1M | 2.2s | At 1,048,574 nodes the recursive CTE reads 4,194,299 shared buffers with its worktable on disk at 11,264kB, Execution Time 2189.152 ms. This is the floor every graph syntax in the post is measured against.QUERY PLAN
Aggregate (cost=2329.86..2329.87 rows=1 width=8) (actual time=2183.125..2183.126 rows=1.00 loops=1)
Buffers: shared hit=4194299, temp read=1568 written=3359
CTE reach
-> Recursive Union (cost=0.42..2320.59 rows=412 width=4) (actual time=0.020..1944.067 rows=1048574.00 loops=1)
Storage: Disk Maximum Storage: 11264kB
Buffers: shared hit=4194299, temp read=1568 written=1568
-> Index Scan using edges_src_idx on edges (cost=0.42..11.48 rows=2 width=4) (actual time=0.017..0.020 rows=2.00 loops=1)
Index Cond: (src = 1)
Index Searches: 1
Buffers: shared hit=5
-> Nested Loop (cost=0.42..230.50 rows=41 width=4) (actual time=27.891..82.209 rows=55188.00 loops=19)
Buffers: shared hit=4194294, temp read=1568 written=3
-> WorkTable Scan on reach r (cost=0.00..0.40 rows=20 width=4) (actual time=0.002..3.934 rows=55188.11 loops=19)
Buffers: temp read=1568 written=3
-> Index Scan using edges_src_idx on edges e (cost=0.42..11.48 rows=2 width=8) (actual time=0.001..0.001 rows=1.00 loops=1048574)
Index Cond: (src = r.b_id)
Index Searches: 1048574
Buffers: shared hit=4194294
-> CTE Scan on reach (cost=0.00..8.24 rows=412 width=0) (actual time=0.020..2136.765 rows=1048574.00 loops=1)
Storage: Disk Maximum Storage: 14328kB
Buffers: shared hit=4194299, temp read=1568 written=3359
Planning Time: 0.184 ms
Execution Time: 2189.152 ms | 14.79s |
Unlike the fixed-depth chain that held flat at a quarter millisecond while its graph grew, this scales with the impacted set: 59 ms, then 299, then 1,156, then 2,189. Fixed depth is cheap and flat. Variable-depth blast radius is neither, and no amount of graph syntax changes that, the work is proportional to what you reach. The plan does one B-tree index probe per reachable node and the UNION dedup spills to disk past the small point.
One thing the plan does that you should know about before you nest this inside a bigger query. The planner estimates the recursion at 402 rows. Every time, at every scale. The truth is up to 1,048,574. Postgres cannot estimate the size of a reachable set, so it picks a fixed default and shrugs. Standalone it does not matter. Feed a 402-versus-a-million miss into an outer join and it will pick a plan for a problem you don't have and radically blunder the one you do (this spectacular performance might be the topic of a future post).
Writing Recursion as a Graph
There is a way to write the recursion in property-graph form right now, and it is the shape the future quantifier will most likely wear. You put a one-hop GRAPH_TABLE inside the recursive term, and the recursion supplies the length that the quantifier cannot:
WITH RECURSIVE reach AS (
  SELECT b_id FROM GRAPH_TABLE (g
    MATCH (a IS node WHERE a.id = 1)-[x IS edge]->(b IS node)
    COLUMNS (b.id AS b_id))
  UNION
  SELECT e.b_id
  FROM GRAPH_TABLE (g
    MATCH (a IS node)-[x IS edge]->(b IS node)
    COLUMNS (a.id AS a_id, b.id AS b_id)) e
  JOIN reach r ON e.a_id = r.b_id
)
SELECT count(*) FROM reach;
Same answer, zero rows in both directions of EXCEPT against the plain recursion. When the quantifier eventually lands, the readable version collapses to one line, -[IS edge]->{1,}, and it will lower to something very much like this. Here is what that costs today.
EXPLAIN ANALYZE
WITH RECURSIVE reach AS (
  SELECT b_id FROM GRAPH_TABLE (g
    MATCH (a IS node WHERE a.id = 1)-[x IS edge]->(b IS node)
    COLUMNS (b.id AS b_id))
  UNION
  SELECT e.b_id
  FROM GRAPH_TABLE (g
    MATCH (a IS node)-[x IS edge]->(b IS node)
    COLUMNS (a.id AS a_id, b.id AS b_id)) e
  JOIN reach r ON e.a_id = r.b_id
)
SELECT count(*) FROM reach
CREATE TABLE nodes (id INT PRIMARY KEY);
INSERT INTO nodes SELECT i FROM generate_series(1, ${NODES}) i;
CREATE TABLE edges (id SERIAL PRIMARY KEY, src INT REFERENCES nodes(id), dst INT REFERENCES nodes(id));
INSERT INTO edges (src, dst)
SELECT i, 2*i FROM generate_series(1, ${NODES}) i WHERE 2*i <= ${NODES}
UNION ALL
SELECT i, 2*i+1 FROM generate_series(1, ${NODES}) i WHERE 2*i+1 <= ${NODES};
CREATE INDEX ON edges(src);
CREATE PROPERTY GRAPH g
VERTEX TABLES ( nodes KEY (id) LABEL node PROPERTIES (id) )
EDGE TABLES ( edges KEY (id) SOURCE KEY (src) REFERENCES nodes(id) DESTINATION KEY (dst) REFERENCES nodes(id) LABEL edge );
VACUUM ANALYZE;| Scale | Time | Plan | Compute |
|---|---|---|---|
| 32.8K | 151.4 ms | The same blast radius with each hop expressed as GRAPH_TABLE inside the recursive CTE. Every step re-resolves vertices through Index Only Scan on nodes_pkey, so buffer traffic rises from 98,300 to 229,370 shared hits for the identical 32,766 nodes. Execution Time 151.410 ms against 59.147 ms.QUERY PLAN
Aggregate (cost=993.95..993.96 rows=1 width=8) (actual time=151.027..151.030 rows=1.00 loops=1)
Buffers: shared hit=229370
CTE reach
-> Recursive Union (cost=0.86..989.40 rows=202 width=4) (actual time=0.011..142.753 rows=32766.00 loops=1)
Storage: Memory Maximum Storage: 1153kB
Buffers: shared hit=229370
-> Nested Loop (cost=0.86..24.26 rows=2 width=4) (actual time=0.009..0.014 rows=2.00 loops=1)
Buffers: shared hit=12
-> Nested Loop (cost=0.57..15.65 rows=2 width=4) (actual time=0.007..0.010 rows=2.00 loops=1)
Buffers: shared hit=7
-> Index Only Scan using nodes_pkey on nodes (cost=0.29..4.30 rows=1 width=4) (actual time=0.004..0.004 rows=1.00 loops=1)
Index Cond: (id = 1)
Heap Fetches: 0
Index Searches: 1
Buffers: shared hit=3
-> Index Scan using edges_src_idx on edges (cost=0.29..11.33 rows=2 width=8) (actual time=0.002..0.004 rows=2.00 loops=1)
Index Cond: (src = 1)
Index Searches: 1
Buffers: shared hit=4
-> Index Only Scan using nodes_pkey on nodes nodes_1 (cost=0.29..4.30 rows=1 width=4) (actual time=0.001..0.001 rows=1.00 loops=2)
Index Cond: (id = edges.dst)
Heap Fetches: 0
Index Searches: 2
Buffers: shared hit=5
-> Nested Loop (cost=0.86..96.31 rows=20 width=4) (actual time=2.239..9.289 rows=2340.29 loops=14)
Buffers: shared hit=229358
-> Nested Loop (cost=0.57..89.99 rows=20 width=4) (actual time=2.238..6.406 rows=2340.29 loops=14)
Buffers: shared hit=163829
-> Nested Loop (cost=0.29..82.50 rows=20 width=8) (actual time=0.002..2.923 rows=2340.43 loops=14)
Buffers: shared hit=65533
-> WorkTable Scan on reach r (cost=0.00..0.40 rows=20 width=4) (actual time=0.000..0.104 rows=2340.43 loops=14)
-> Index Only Scan using nodes_pkey on nodes nodes_2 (cost=0.29..4.10 rows=1 width=4) (actual time=0.001..0.001 rows=1.00 loops=32766)
Index Cond: (id = r.b_id)
Heap Fetches: 0
Index Searches: 32766
Buffers: shared hit=65533
-> Index Scan using edges_src_idx on edges edges_1 (cost=0.29..0.35 rows=2 width=8) (actual time=0.001..0.001 rows=1.00 loops=32766)
Index Cond: (src = nodes_2.id)
Index Searches: 32766
Buffers: shared hit=98296
-> Index Only Scan using nodes_pkey on nodes nodes_3 (cost=0.29..0.32 rows=1 width=4) (actual time=0.001..0.001 rows=1.00 loops=32764)
Index Cond: (id = edges_1.dst)
Heap Fetches: 0
Index Searches: 32764
Buffers: shared hit=65529
-> CTE Scan on reach (cost=0.00..4.04 rows=202 width=0) (actual time=0.011..149.179 rows=32766.00 loops=1)
Storage: Memory Maximum Storage: 1280kB
Buffers: shared hit=229370
Planning:
Buffers: shared hit=21
Planning Time: 0.585 ms
Execution Time: 151.410 ms | 0.90s |
| 131.1K | 608.2 ms | At 131,070 nodes the GRAPH_TABLE recursion reads 1,048,569 shared buffers, twice the plain CTE, Execution Time 608.223 ms against 298.997 ms. The vertex-resolution join happens per hop, so the tax scales with the traversal.QUERY PLAN
Aggregate (cost=1062.00..1062.01 rows=1 width=8) (actual time=606.481..606.483 rows=1.00 loops=1)
Buffers: shared hit=1048569, temp written=223
CTE reach
-> Recursive Union (cost=1.00..1057.46 rows=202 width=4) (actual time=0.014..566.086 rows=131070.00 loops=1)
Storage: Memory Maximum Storage: 4404kB
Buffers: shared hit=1048569
-> Nested Loop (cost=1.00..24.41 rows=2 width=4) (actual time=0.012..0.016 rows=2.00 loops=1)
Buffers: shared hit=13
-> Nested Loop (cost=0.71..15.79 rows=2 width=4) (actual time=0.009..0.012 rows=2.00 loops=1)
Buffers: shared hit=8
-> Index Only Scan using nodes_pkey on nodes (cost=0.29..4.31 rows=1 width=4) (actual time=0.004..0.005 rows=1.00 loops=1)
Index Cond: (id = 1)
Heap Fetches: 0
Index Searches: 1
Buffers: shared hit=3
-> Index Scan using edges_src_idx on edges (cost=0.42..11.46 rows=2 width=8) (actual time=0.004..0.006 rows=2.00 loops=1)
Index Cond: (src = 1)
Index Searches: 1
Buffers: shared hit=5
-> Index Only Scan using nodes_pkey on nodes nodes_1 (cost=0.29..4.31 rows=1 width=4) (actual time=0.001..0.001 rows=1.00 loops=2)
Index Cond: (id = edges.dst)
Heap Fetches: 0
Index Searches: 2
Buffers: shared hit=5
-> Nested Loop (cost=1.00..103.10 rows=20 width=4) (actual time=8.335..31.924 rows=8191.75 loops=16)
Buffers: shared hit=1048556
-> Nested Loop (cost=0.71..96.68 rows=20 width=4) (actual time=8.332..22.548 rows=8191.75 loops=16)
Buffers: shared hit=786419
-> Nested Loop (cost=0.29..86.60 rows=20 width=8) (actual time=0.002..9.827 rows=8191.88 loops=16)
Buffers: shared hit=262141
-> WorkTable Scan on reach r (cost=0.00..0.40 rows=20 width=4) (actual time=0.000..0.352 rows=8191.88 loops=16)
-> Index Only Scan using nodes_pkey on nodes nodes_2 (cost=0.29..4.31 rows=1 width=4) (actual time=0.001..0.001 rows=1.00 loops=131070)
Index Cond: (id = r.b_id)
Heap Fetches: 0
Index Searches: 131070
Buffers: shared hit=262141
-> Index Scan using edges_src_idx on edges edges_1 (cost=0.42..0.48 rows=2 width=8) (actual time=0.001..0.001 rows=1.00 loops=131070)
Index Cond: (src = nodes_2.id)
Index Searches: 131070
Buffers: shared hit=524278
-> Index Only Scan using nodes_pkey on nodes nodes_3 (cost=0.29..0.32 rows=1 width=4) (actual time=0.001..0.001 rows=1.00 loops=131068)
Index Cond: (id = edges_1.dst)
Heap Fetches: 0
Index Searches: 131068
Buffers: shared hit=262137
-> CTE Scan on reach (cost=0.00..4.04 rows=202 width=0) (actual time=0.014..599.629 rows=131070.00 loops=1)
Storage: Disk Maximum Storage: 4096kB
Buffers: shared hit=1048569, temp written=223
Planning:
Buffers: shared hit=23
Planning Time: 0.563 ms
Execution Time: 608.223 ms | 3.35s |
| 524.3K | 2.9s | At 524,286 nodes, 5,242,870 shared hits and worktable Storage: Disk 8,192kB, Execution Time 2921.173 ms against 1156.342 ms for the plain recursive CTE. Same indexed edge traversal, 2.5x the time.QUERY PLAN
Aggregate (cost=1115.38..1115.39 rows=1 width=8) (actual time=2914.743..2914.748 rows=1.00 loops=1)
Buffers: shared hit=5242870, temp read=672 written=1567
CTE reach
-> Recursive Union (cost=1.27..1110.83 rows=202 width=4) (actual time=0.013..2759.491 rows=524286.00 loops=1)
Storage: Disk Maximum Storage: 8192kB
Buffers: shared hit=5242870, temp read=672 written=672
-> Nested Loop (cost=1.27..24.81 rows=2 width=4) (actual time=0.012..0.017 rows=2.00 loops=1)
Buffers: shared hit=16
-> Nested Loop (cost=0.84..15.93 rows=2 width=4) (actual time=0.009..0.012 rows=2.00 loops=1)
Buffers: shared hit=9
-> Index Only Scan using nodes_pkey on nodes (cost=0.42..4.44 rows=1 width=4) (actual time=0.005..0.005 rows=1.00 loops=1)
Index Cond: (id = 1)
Heap Fetches: 0
Index Searches: 1
Buffers: shared hit=4
-> Index Scan using edges_src_idx on edges (cost=0.42..11.47 rows=2 width=8) (actual time=0.003..0.004 rows=2.00 loops=1)
Index Cond: (src = 1)
Index Searches: 1
Buffers: shared hit=5
-> Index Only Scan using nodes_pkey on nodes nodes_1 (cost=0.42..4.44 rows=1 width=4) (actual time=0.001..0.002 rows=1.00 loops=2)
Index Cond: (id = edges.dst)
Heap Fetches: 0
Index Searches: 2
Buffers: shared hit=7
-> Nested Loop (cost=1.27..108.40 rows=20 width=4) (actual time=39.031..138.418 rows=29126.89 loops=18)
Buffers: shared hit=5242854, temp read=672 written=2
-> Nested Loop (cost=0.84..99.38 rows=20 width=4) (actual time=39.030..97.049 rows=29126.89 loops=18)
Buffers: shared hit=3670001, temp read=672 written=2
-> Nested Loop (cost=0.42..89.20 rows=20 width=8) (actual time=0.005..46.125 rows=29127.00 loops=18)
Buffers: shared hit=1572859, temp read=672 written=2
-> WorkTable Scan on reach r (cost=0.00..0.40 rows=20 width=4) (actual time=0.002..2.634 rows=29127.00 loops=18)
Buffers: temp read=672 written=2
-> Index Only Scan using nodes_pkey on nodes nodes_2 (cost=0.42..4.44 rows=1 width=4) (actual time=0.001..0.001 rows=1.00 loops=524286)
Index Cond: (id = r.b_id)
Heap Fetches: 0
Index Searches: 524286
Buffers: shared hit=1572859
-> Index Scan using edges_src_idx on edges edges_1 (cost=0.42..0.49 rows=2 width=8) (actual time=0.001..0.001 rows=1.00 loops=524286)
Index Cond: (src = nodes_2.id)
Index Searches: 524286
Buffers: shared hit=2097142
-> Index Only Scan using nodes_pkey on nodes nodes_3 (cost=0.42..0.45 rows=1 width=4) (actual time=0.001..0.001 rows=1.00 loops=524284)
Index Cond: (id = edges_1.dst)
Heap Fetches: 0
Index Searches: 524284
Buffers: shared hit=1572853
-> CTE Scan on reach (cost=0.00..4.04 rows=202 width=0) (actual time=0.014..2883.685 rows=524286.00 loops=1)
Storage: Disk Maximum Storage: 7160kB
Buffers: shared hit=5242870, temp read=672 written=1567
Planning:
Buffers: shared hit=28
Planning Time: 0.480 ms
Execution Time: 2921.173 ms | 12.87s |
| 1M | 6s | At 1,048,574 nodes the GRAPH_TABLE recursion reaches 10,485,750 shared buffer hits and Execution Time 5964.955 ms, 2.7x the plain recursive CTE at 2189.152 ms. SQL/PGQ syntax on PostgreSQL 19beta1 buys vertex lookups, not a better algorithm.QUERY PLAN
Aggregate (cost=1116.84..1116.85 rows=1 width=8) (actual time=5956.278..5956.281 rows=1.00 loops=1)
Buffers: shared hit=10485750, temp read=1568 written=3359
CTE reach
-> Recursive Union (cost=1.27..1112.29 rows=202 width=4) (actual time=0.013..5648.270 rows=1048574.00 loops=1)
Storage: Disk Maximum Storage: 11264kB
Buffers: shared hit=10485750, temp read=1568 written=1568
-> Nested Loop (cost=1.27..24.78 rows=2 width=4) (actual time=0.011..0.016 rows=2.00 loops=1)
Buffers: shared hit=16
-> Nested Loop (cost=0.85..15.89 rows=2 width=4) (actual time=0.008..0.011 rows=2.00 loops=1)
Buffers: shared hit=9
-> Index Only Scan using nodes_pkey on nodes (cost=0.42..4.44 rows=1 width=4) (actual time=0.004..0.005 rows=1.00 loops=1)
Index Cond: (id = 1)
Heap Fetches: 0
Index Searches: 1
Buffers: shared hit=4
-> Index Scan using edges_src_idx on edges (cost=0.42..11.43 rows=2 width=8) (actual time=0.003..0.005 rows=2.00 loops=1)
Index Cond: (src = 1)
Index Searches: 1
Buffers: shared hit=5
-> Index Only Scan using nodes_pkey on nodes nodes_1 (cost=0.42..4.44 rows=1 width=4) (actual time=0.001..0.001 rows=1.00 loops=2)
Index Cond: (id = edges.dst)
Heap Fetches: 0
Index Searches: 2
Buffers: shared hit=7
-> Nested Loop (cost=1.27..108.55 rows=20 width=4) (actual time=76.405..269.066 rows=55188.00 loops=19)
Buffers: shared hit=10485734, temp read=1568 written=3
-> Nested Loop (cost=0.85..99.48 rows=20 width=4) (actual time=76.404..188.922 rows=55188.00 loops=19)
Buffers: shared hit=7340017, temp read=1568 written=3
-> Nested Loop (cost=0.42..89.25 rows=20 width=8) (actual time=0.007..90.780 rows=55188.11 loops=19)
Buffers: shared hit=3145723, temp read=1568 written=3
-> WorkTable Scan on reach r (cost=0.00..0.40 rows=20 width=4) (actual time=0.003..5.706 rows=55188.11 loops=19)
Buffers: temp read=1568 written=3
-> Index Only Scan using nodes_pkey on nodes nodes_2 (cost=0.42..4.44 rows=1 width=4) (actual time=0.001..0.001 rows=1.00 loops=1048574)
Index Cond: (id = r.b_id)
Heap Fetches: 0
Index Searches: 1048574
Buffers: shared hit=3145723
-> Index Scan using edges_src_idx on edges edges_1 (cost=0.42..0.49 rows=2 width=8) (actual time=0.001..0.001 rows=1.00 loops=1048574)
Index Cond: (src = nodes_2.id)
Index Searches: 1048574
Buffers: shared hit=4194294
-> Index Only Scan using nodes_pkey on nodes nodes_3 (cost=0.42..0.45 rows=1 width=4) (actual time=0.001..0.001 rows=1.00 loops=1048572)
Index Cond: (id = edges_1.dst)
Heap Fetches: 0
Index Searches: 1048572
Buffers: shared hit=3145717
-> CTE Scan on reach (cost=0.00..4.04 rows=202 width=0) (actual time=0.014..5889.464 rows=1048574.00 loops=1)
Storage: Disk Maximum Storage: 14328kB
Buffers: shared hit=10485750, temp read=1568 written=3359
Planning:
Buffers: shared hit=28
Planning Time: 0.556 ms
Execution Time: 5964.955 ms | 27.23s |
151 ms, 608, 2,921, 5,965. Roughly 2 to 2.5x the plain recursion, holding flat across the whole grid. The tax has a mechanism, visible in the plan. The plain recursion does one index operation per frontier node, a scan on edges(src). The graph form does three: an index-only scan on nodes_pkey to turn the frontier value into a source vertex, the edges(src) scan, then another nodes_pkey scan to resolve the destination vertex. GRAPH_TABLE always resolves pattern endpoints through the vertex table. The hand-written walk skips it, because in the edge table the destination already is the node id. Inside a recursion, that "resolve the vertex" step runs once per frontier node, so a constant per-hop overhead becomes a multiplicative 2x.
Apache AGE: Cypher over the same tables
Postgres already has a graph extension that does variable-length traversal today, Apache AGE, openCypher on top of Postgres. It gives you the *1.. quantifier that core SQL/PGQ rejects. AGE 1.8.0 runs on PG19beta1, which surprised me because the public docs stopped at PG18. The query is the one line we were hoping to be able to do:
SELECT * FROM cypher('bench_graph', $$
  MATCH (a:Account {id: 1})-[:SENT*1..]->(b:Account)
  RETURN b.id
$$) AS (reachable agtype);EXPLAIN ANALYZE
SELECT * FROM cypher('bench_graph', $$
MATCH (a:Account {id: 1})-[:SENT*1..]->(b:Account)
RETURN b.id
$$) AS (reachable agtype)CREATE EXTENSION IF NOT EXISTS age;
SET search_path = ag_catalog, "$user", public;
SELECT create_graph('bench_graph');
SELECT create_vlabel('bench_graph','Account');
SELECT create_elabel('bench_graph','SENT');
INSERT INTO bench_graph."Account" (id, properties)
SELECT _graphid(_label_id('bench_graph','Account'), i), agtype_build_map('id', i)
FROM generate_series(1, ${N}) i;
INSERT INTO bench_graph."SENT" (id, start_id, end_id, properties)
SELECT _graphid(_label_id('bench_graph','SENT'), (row_number() over ())::bigint),
_graphid(_label_id('bench_graph','Account'), src),
_graphid(_label_id('bench_graph','Account'), dst),
agtype_build_map()
FROM (
SELECT i AS src, 2*i AS dst FROM generate_series(1, ${N}) i WHERE 2*i <= ${N}
UNION ALL SELECT i, 2*i+1 FROM generate_series(1, ${N}) i WHERE 2*i+1 <= ${N}
) e;
CREATE INDEX ON bench_graph."Account" USING gin (properties);
VACUUM ANALYZE;| Scale | Time | Plan | Compute |
|---|---|---|---|
| 32.8K | 101 ms | Blast radius in Apache AGE Cypher, MATCH (a:Account {id: 1})-[:SENT*1..]->(b:Account). Bitmap Index Scan on Account_properties_idx resolves the agtype containment lookup, then Nested Loop walks the edges: 90,193 shared hits plus 1,160 temp blocks, Execution Time 100.962 ms for 32,766 nodes.QUERY PLAN
Nested Loop (cost=21.99..533.23 rows=1 width=32) (actual time=39.275..98.944 rows=32766.00 loops=1)
Buffers: shared hit=90193, temp read=1160 written=1160
-> Nested Loop (cost=21.71..531.46 rows=1 width=8) (actual time=39.251..46.894 rows=32766.00 loops=1)
Buffers: shared hit=8, temp read=1160 written=1160
-> Bitmap Heap Scan on "Account" a (cost=21.70..117.31 rows=33 width=8) (actual time=0.057..0.059 rows=1.00 loops=1)
Recheck Cond: (properties @> '{"id": 1}'::agtype)
Heap Blocks: exact=1
Buffers: shared hit=8
-> Bitmap Index Scan on "Account_properties_idx" (cost=0.00..21.69 rows=33 width=0) (actual time=0.045..0.046 rows=1.00 loops=1)
Index Cond: (properties @> '{"id": 1}'::agtype)
Index Searches: 1
Buffers: shared hit=7
-> Function Scan on age_vle _age_default_alias_0 (cost=0.01..12.51 rows=5 width=16) (actual time=39.192..45.144 rows=32766.00 loops=1)
Filter: (a.id = start_id)
Buffers: temp read=1160 written=1160
-> Index Scan using "Account_pkey" on "Account" b (cost=0.29..1.77 rows=1 width=37) (actual time=0.001..0.001 rows=1.00 loops=32766)
Index Cond: (id = _age_default_alias_0.end_id)
Index Searches: 32766
Buffers: shared hit=90185
Planning:
Buffers: shared hit=1
Planning Time: 0.344 ms
Execution Time: 100.962 ms | 0.89s |
| 131.1K | 418.8 ms | At 131,070 nodes AGE reads 360,940 shared buffers and writes 5,152 temp blocks, Execution Time 418.805 ms. That sits between the plain recursive CTE at 298.997 ms and the GRAPH_TABLE recursion at 608.223 ms.QUERY PLAN
Nested Loop (cost=31.04..2051.64 rows=1 width=32) (actual time=159.361..411.143 rows=131070.00 loops=1)
Buffers: shared hit=360940, temp read=5152 written=5152
-> Nested Loop (cost=30.74..2047.13 rows=1 width=8) (actual time=159.333..192.150 rows=131070.00 loops=1)
Buffers: shared hit=10, temp read=5152 written=5152
-> Bitmap Heap Scan on "Account" a (cost=30.74..403.08 rows=131 width=8) (actual time=0.049..0.051 rows=1.00 loops=1)
Recheck Cond: (properties @> '{"id": 1}'::agtype)
Heap Blocks: exact=1
Buffers: shared hit=10
-> Bitmap Index Scan on "Account_properties_idx" (cost=0.00..30.71 rows=131 width=0) (actual time=0.040..0.040 rows=1.00 loops=1)
Index Cond: (properties @> '{"id": 1}'::agtype)
Index Searches: 1
Buffers: shared hit=9
-> Function Scan on age_vle _age_default_alias_0 (cost=0.01..12.51 rows=5 width=16) (actual time=159.282..184.875 rows=131070.00 loops=1)
Filter: (a.id = start_id)
Buffers: temp read=5152 written=5152
-> Index Scan using "Account_pkey" on "Account" b (cost=0.29..4.50 rows=1 width=37) (actual time=0.001..0.001 rows=1.00 loops=131070)
Index Cond: (id = _age_default_alias_0.end_id)
Index Searches: 131070
Buffers: shared hit=360930
Planning:
Buffers: shared hit=1
Planning Time: 0.287 ms
Execution Time: 418.805 ms | 3.41s |
| 524.3K | 1.9s | At 524,286 nodes AGE writes 22,656 temp blocks against 1,968,209 shared hits, Execution Time 1873.619 ms. Cypher's variable-length pattern does run, which GRAPH_TABLE's quantifier cannot, and costs 1.6x the plain recursive CTE.QUERY PLAN
Nested Loop (cost=33.25..8102.79 rows=1 width=32) (actual time=757.714..1844.102 rows=524286.00 loops=1)
Buffers: shared hit=1968209, temp read=22656 written=22656
-> Nested Loop (cost=32.83..8095.79 rows=1 width=8) (actual time=757.684..885.929 rows=524286.00 loops=1)
Buffers: shared hit=10, temp read=22656 written=22656
-> Bitmap Heap Scan on "Account" a (cost=32.82..1519.58 rows=524 width=8) (actual time=0.047..0.048 rows=1.00 loops=1)
Recheck Cond: (properties @> '{"id": 1}'::agtype)
Heap Blocks: exact=1
Buffers: shared hit=10
-> Bitmap Index Scan on "Account_properties_idx" (cost=0.00..32.69 rows=524 width=0) (actual time=0.038..0.039 rows=1.00 loops=1)
Index Cond: (properties @> '{"id": 1}'::agtype)
Index Searches: 1
Buffers: shared hit=9
-> Function Scan on age_vle _age_default_alias_0 (cost=0.01..12.51 rows=5 width=16) (actual time=757.636..857.667 rows=524286.00 loops=1)
Filter: (a.id = start_id)
Buffers: temp read=22656 written=22656
-> Index Scan using "Account_pkey" on "Account" b (cost=0.42..7.00 rows=1 width=37) (actual time=0.001..0.001 rows=1.00 loops=524286)
Index Cond: (id = _age_default_alias_0.end_id)
Index Searches: 524286
Buffers: shared hit=1968199
Planning:
Buffers: shared hit=1
Planning Time: 0.259 ms
Execution Time: 1873.619 ms | 13.03s |
| 1M | 4.5s | At 1,048,574 nodes Apache AGE spills 47,360 temp blocks and finishes in 4541.892 ms against 2189.152 ms for the recursive CTE, a 2.1x tax for Cypher syntax over the same reachability. Bitmap Heap Scan plus Nested Loop throughout.QUERY PLAN
Nested Loop (cost=44.52..16190.15 rows=1 width=32) (actual time=1868.967..4472.216 rows=1048574.00 loops=1)
Buffers: shared hit=3936473, temp read=47360 written=47360
-> Nested Loop (cost=44.09..16182.51 rows=1 width=8) (actual time=1868.938..2192.084 rows=1048574.00 loops=1)
Buffers: shared hit=10, temp read=47360 written=47360
-> Bitmap Heap Scan on "Account" a (cost=44.09..3017.56 rows=1049 width=8) (actual time=0.061..0.063 rows=1.00 loops=1)
Recheck Cond: (properties @> '{"id": 1}'::agtype)
Heap Blocks: exact=1
Buffers: shared hit=10
-> Bitmap Index Scan on "Account_properties_idx" (cost=0.00..43.82 rows=1049 width=0) (actual time=0.048..0.048 rows=1.00 loops=1)
Index Cond: (properties @> '{"id": 1}'::agtype)
Index Searches: 1
Buffers: shared hit=9
-> Function Scan on age_vle _age_default_alias_0 (cost=0.01..12.51 rows=5 width=16) (actual time=1868.876..2124.922 rows=1048574.00 loops=1)
Filter: (a.id = start_id)
Buffers: temp read=47360 written=47360
-> Index Scan using "Account_pkey" on "Account" b (cost=0.42..7.63 rows=1 width=37) (actual time=0.001..0.001 rows=1.00 loops=1048574)
Index Cond: (id = _age_default_alias_0.end_id)
Index Searches: 1048574
Buffers: shared hit=3936463
Planning:
Buffers: shared hit=1
Planning Time: 0.237 ms
Execution Time: 4541.892 ms | 27.60s |
101 ms, 419, 1,874, 4,542. Faster than the emulated GRAPH_TABLE recursion, slower than the plain CTE. Here are all three on one grid.
The plain recursive CTE is the floor at every size. Both graph forms cluster above it, AGE at roughly 1.4 to 2.1x the plain walk, the emulated recursion at roughly 2 to 2.5x. Same tax, different cashier. AGE pays it as a per-result property fetch, SQL/PGQ pays it as per-hop endpoint resolution. Vertex resolution is the cost of looking like a graph, whoever charges it.
The thing to understand about AGE is what shows up in its plan: Function Scan on age_vle. That is AGE's variable-length-edge engine, a C function. When it sees -[:SENT*1..]->, it does not emit a graph operator, it rewrites the pattern into a call to age_vle, which walks the SENT edge table by following start_id to end_id, expanding outward, deduplicating, and hands back the reachable pairs. Then an outer nested loop joins those ids back to the Account table to fetch each node.
Which means age_vle walks the edge table by B-tree index, one O(log n) descent per hop, several buffer pages each. That is index-based adjacency. Index-free adjacency, the Neo4j property, stores a direct pointer from each node to its edges, so a hop is a pointer dereference and traversal cost tracks the region you visit, not the size of the database. AGE stores the graph in ordinary Postgres tables, so it inherits Postgres's index-lookup traversal. It gives you Cypher and the quantifier. The machine underneath is still indexed relational traversal, not pointer chasing, which is exactly why its curve looks like the recursive CTE's.
So AGE is a real expressiveness win and, measurably, not a speed win. It buys the *1.. quantifier that core PG19 rejects, for about 2x the cost of a hand-written recursive CTE. That is an honest trade, and worth it when the query legibility matters more than the last 2x. It is not the graph engine the folklore promised. The genuine index-free-adjacency comparison is Neo4j, and that is a separate measurement that I will do in part 2.
What comes next
Every section here has carried the same asterisk: none of it is index-free adjacency. Postgres, AGE, the recursive CTE, they all ride indexed relational traversal, a B-tree descent per hop. The one engine that stores direct node-to-edge pointers and traverses by chasing them instead of probing an index is Neo4j, and it is the only contender I have not put on the page. Part 2 fixes that. I will run Neo4j on both of Part 1's questions, the fixed-depth typed chain and the variable-depth blast radius, and measure where pointer-chasing beats indexed joins and where the folklore oversold it.
Part 3 goes back for the axis this post skipped. I ranked the two schemas on legibility and speed, and a clean table-per-type schema won both. That ranking is incomplete, because it leaves out the thing a graph database is actually sold on: schema flexibility. This tension is real because the syntax that looks most like a graph i.e. per-type labels (lb IS LoadBalancer), needs a schema that behaves least like one: every type declared up front and a migration for every new type. The flexible single typed table, where a new type is just a row you insert at runtime, is uglier and slower, and it is also behaves more like a real graph. Part 3 measures that trade, and shows where the pretty syntax quietly costs you a migration.
The Limits
These numbers are honest about a narrow thing and you should not stretch them. The data is synthetic, a controlled binary tree and a 3-ary forest chosen so the reachable set is exact and tunable, which is right for isolating the mechanism and wrong for predicting your production skew. This is Postgres 19 beta, so plans and costs can move before GA. Every graph here lives in Postgres tables, so nothing measured here is index-free adjacency, and the one contender that has it, Neo4j, is not in this post. Timings are single-machine, warm-cache, and vary run to run; the buffer counts and the plan shapes are the stable part, and they are what the argument rests on.
What holds up is the shape of the thing. At fixed depth, the PG19 graph query is your join with better handwriting. At variable depth, it is a recursive CTE, whether you write the CTE, emulate it with GRAPH_TABLE, or let AGE wrap it in Cypher. The syntax is new. The machine underneath is the one you already had.
When Postgres 19 ships
One last thing, and it is the part I have been waiting for. Everything above ran in local mode against a beta image, because that is all that exists today. When Postgres 19 goes GA, I get to fold it into ExoBench the way exobench.ai already spins up a real Postgres, runs your query at a few million rows, and hands back the plan. When that lands, the graph question stops being something I measured on a synthetic tree in a Docker container, and becomes something you can point at your own topology, your own fan-out, your own blast radius, and get real numbers back in minutes. I have wanted to benchmark this feature since it hit beta, and soon I won't need a fake pool for it.