Update, 2026-07-31. I've since run five more models and collected more samples on these seven, and written it up in The Cheapest Model Per Run Was the Most Expensive Per Real Fix. The thesis below holds and the compression got stronger. One result here did not survive: Gemini's 4.3 tool calls came from three runs, two of which were infrastructure crashes. With five clean runs it sits at 9.0 calls and is never the cheapest model at any per-call price. The break-even bands below have all moved. I've left the original text intact apart from striking the Gemini claim in the summary.
Summary for the Impatient
I gave seven AI models the same job: speed up one slow 5-table SQL query at 1 million rows, using ExoBench to run real benchmarks. Same prompt, same query, same schema, one clean-room test rig per model. Then I priced each run as token_cost + $0.20 per tool call, because every ExoBench call is real server compute that costs the same no matter which model asks for it.
The cheap models made the most tool calls. glm-4.7 averaged 11.7 calls per run, deepseek-v4-flash averaged 9.6, and kimi 10. The frontier models made the fewest: opus-4.8 at 3.7, gemini at 4.3. Token cost across the seven spans was about 134x. Once you add a flat $0.20 floor per call, total cost compresses to about 2.75x, and tool discipline drives the ranking more than token price does. The expensive model I was "supposed" to avoid, opus-4.8, becomes the cheapest once each tool call costs more than about $3.33. It passes the chatty cheap models long before that. (Losing only to Gemini, which reigns supreme starting $0.06 per tool call. Struck 2026-07-31: that number came from three runs, two of them crashes. See the update note above.)
The reason is simple. If you a model a criterion it can check and can't immediately satisfy, the weaker one will keep calling the benchmark trying different things, until something sticks. Usually something blunt like a materialized view. Stronger will find a much more clever fix (denormalize plus a covering index) in a fraction of the steps.
The setup: a clean room and one nasty query
I wanted to test a claim I've had in my head for a while. The folklore says pick a cheaper model to save money. My read is that the folklore quietly assumes the model answers in roughly one shot. The moment you hand an agent something it can verify, and can't solve on the first try, the accounting changes because it can keep going and going.
So I built a test rig that runs a single model as an agent with ExoBench wired in over MCP. The model gets web search and the ExoBench benchmarking tools, nothing else. It calls benchmarkSql, ExoBench spins up a fresh Postgres, generates data at the scale I ask for, runs EXPLAIN ANALYZE, and hands back a real plan with real timings. The model reads that, forms a hypothesis, and calls again. The cycle stops when it decides it's done. I count every ExoBench call it makes along the way. Same system prompt, same task prompt, same query for every model, so the only thing moving is the model itself.
The query is a regional operations report. Count the orders and sum the shipping cost for one region, across a five-table join.
SELECT count(*) AS order_count, sum(s.shipping_cost) AS total_shipping
FROM orders o
JOIN customers c  ON c.id = o.customer_id
JOIN products p   ON p.id = o.product_id
JOIN warehouses w ON w.id = o.warehouse_id
JOIN shipments s  ON s.order_id = o.id
WHERE c.region_id = 7 AND p.region_id = 7 AND w.region_id = 7;
The nasty part is the three region filters, which live on three different tables. Postgres multiplies their selectivities as if they were independent and estimates about 1,000 surviving rows. The real number at 1M is closer to 85,000. That 85x underestimate feeds a bad join into shipments, and the query lands at about 137ms. I told each model the schema, the data distribution (10 regions, 95% of orders in the customer's own region, 90% shipping from a warehouse in-region), and turned it loose. The exact prompt is in the appendix.
The result
Here's the whole thing in one plot. One dot per model, averaged over its runs. Left to right is how chatty the model was (i.e. mean tool calls). Bottom to top is mean token cost per run, log scale.
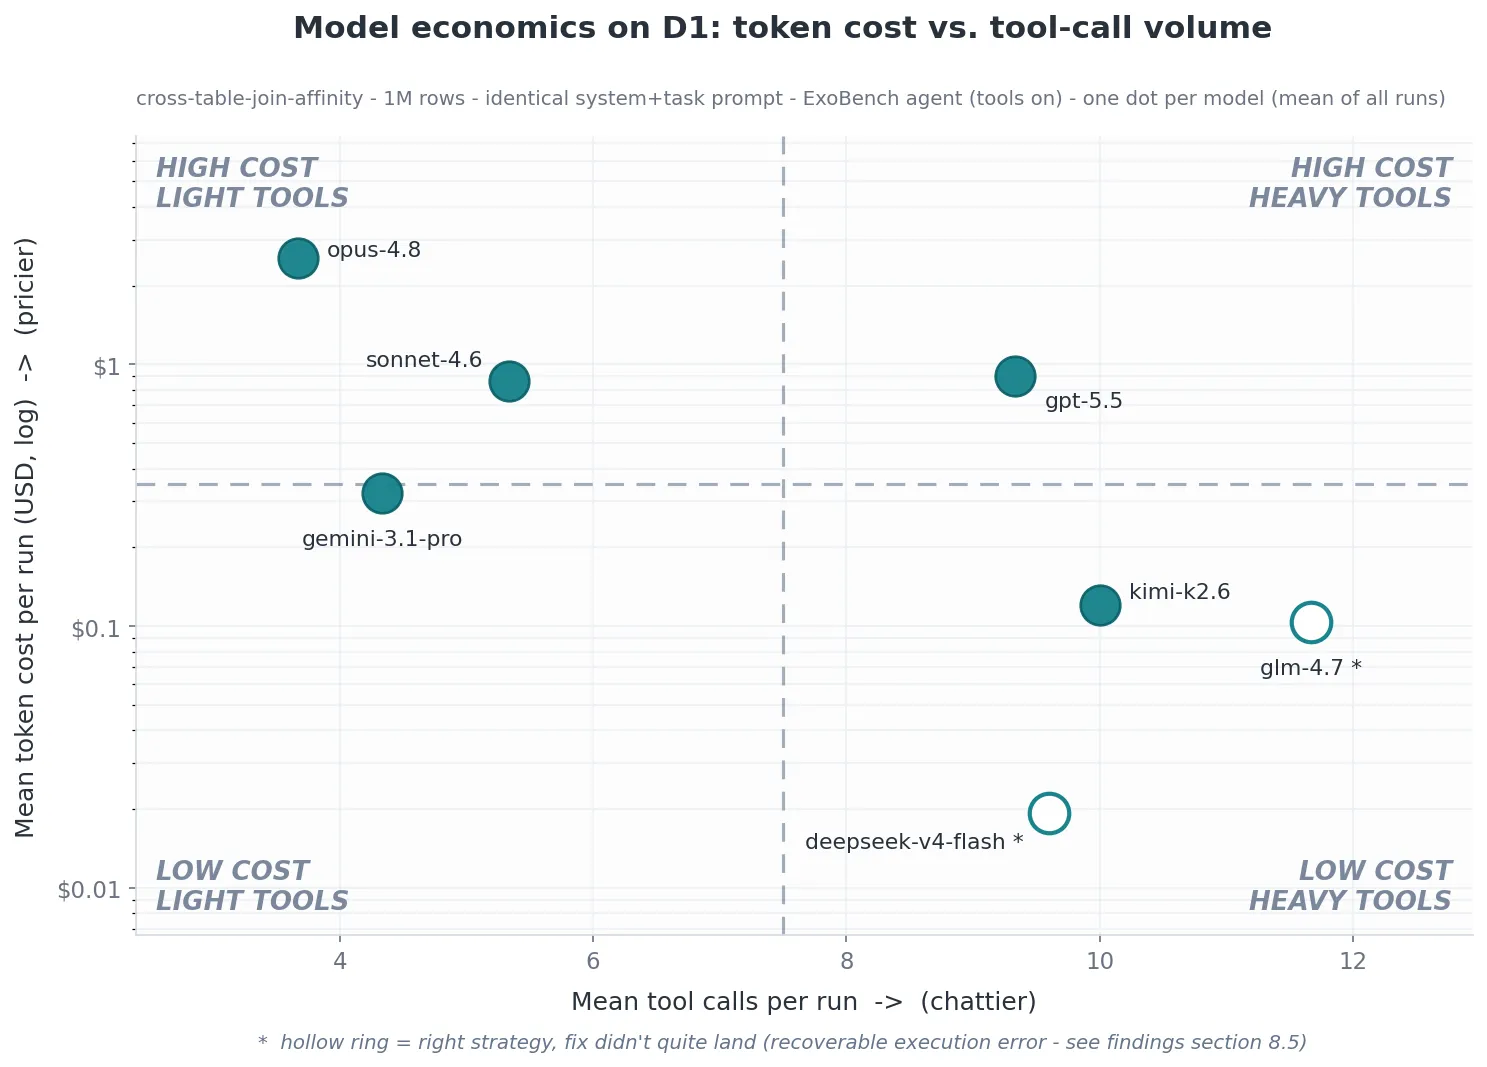
The expensive models cluster on the left, making just a few calls, the cheap models sit on the right making many more.
Now put a price on a tool call. Each ExoBench call is a fresh database provision plus EXPLAIN ANALYZE at scale, and it costs the same whether opus or deepseek requested it. I used $0.20 as a reasonable approximation, the shape of the result doesn't depend on the exact value.
| Model | mean tool calls | token $ / run | + tool floor @ $0.20 | total $ / run |
|---|---|---|---|---|
| gemini-3.1-pro | 4.3 | 0.323 | 0.87 | 1.19 |
| sonnet-4.6 | 5.3 | 0.865 | 1.07 | 1.93 |
| deepseek-v4-flash | 9.6 | 0.019 | 1.92 | 1.94 |
| kimi-k2.6 | 10.0 | 0.121 | 2.00 | 2.12 |
| glm-4.7 | 11.7 | 0.104 | 2.33 | 2.44 |
| gpt-5.5 | 9.3 | 0.906 | 1.87 | 2.77 |
| opus-4.8 | 3.7 | 2.543 | 0.73 | 3.28 |
Look at deepseek. Its token cost is $0.019 a run, about 134x cheaper than opus. On tokens alone it wins by a mile. Add the floor and it's $1.94, a hair above gemini and sonnet, because it paid the flat $0.20 nine and a half times. deepseek spent 99% of its bill on the tool-calls (i.e. the 'floor').
(A caveat on the messy bits, briefly. opus and sonnet originally ran without prompt caching while the rest were billed with their cache discount, so their token costs here are corrected using their measured cache rates of 67% and 76% to keep the comparison fair. Gemini only landed a valid fix on 1 of 3 runs; the other two died on a random API error that had nothing to do with the model. glm and deepseek never produced a valid fix on the first shot at all, which turns out to be a more interesting story than "they failed," and I'll get to it. None of this moves the headline.)
The interesting number is the break-even.
- When a tool call is nearly free (under about $0.06), deepseek wins on raw token price.
- Across the broad middle (about $0.06 to $3.33 per call), gemini wins. It's the balanced one: low token cost and only 4.3 calls.
- Above about $3.33 per call, opus-4.8 wins. The most expensive model per token is the cheapest to tool.
And opus passes the chatty cheap models way before that $3.33 mark. It overtakes gpt-5.5 at $0.29 a call, glm at $0.30, kimi at $0.38, deepseek at $0.43. Four of the "cheap" options never sit on the bottom line at any range price at all so they lose everywhere. Tool discipline is the real moat, and the cheap models here didn't have it.
What the models actually did
The tool-call count tracks what kind of solution each model went looking for, and the fixes fall into three buckets.
The honest fix is to denormalize. Fold shipping_cost and the region columns into orders, build one composite covering index, and keep a real aggregation query that still counts and sums at run time. That takes the query from 137ms to about 20ms, a real 7x improvement, and it holds for the whole class of query. Sonnet did this on all 3 of its runs Opus did it on 2 of the 3. They also did it with very few tool-calls: sonnet in 5.3 calls, opus in 3.7. They read the plan, saw the join blow up, and went straight for the structural fix.
The precompute fix is to build a materialized view holding the exact count and sum per region, so the timed query becomes a one-row lookup. That "wins" at north of 2,000x. It's valid SQL and a correct answer, and it games a static benchmark by caching the specific answer instead of speeding up the query. The gpt-5.5 model did this on every valid session at a chatty, 9.3 calls a run, right in the cheap models' territory on the x-axis. Power didn't buy it discipline because it found a working answer and kept poking anyway.
The third bucket is where the cheap models landed, and it's the part I found genuinely interesting. The glm model went 0 for 6, deepseek 0 for 5, no valid fix on the first shot. When I read every failed attempt line by line I saw they weren't failing on strategy. Both models independently rediscovered the same denormalize-plus-covering-index approach that won for opus and sonnet but they kept blowing up on a mechanical Postgres gotcha: adding a NOT NULL column to an already-populated table without a default. This aborted the whole batch before anything got timed. One of deepseek's runs is one keyword away from the frontier winner. It did more than the winners (it even dropped the shipments table), then tripped on the last lace. Also, deepseek created a table and forgot to populate it, so the benchmark read an empty table and returned count = 0 in 0.008ms. A 3,900x "speedup" that's an invalid answer.
So the picture is: the cheap models read the criterion, understood the real fix, and then made call after call trying to make it execute, tripping on dialect details while a stronger model sailed past. That's what it looks like when a model can check its work but can't quite land it. It keeps reaching for the tool-call button.
So is the cheap model cheaper?
Not even close once tool-calls are in the picture. The sobering reading is that tool discipline is its own axis, separate from both power and price. More powerful models tended to use fewer calls because they found good solutions faster but not always. Gemini at 4.3 and opus at 3.7 are frugal and effective but gpt-5.5 shows that power alone doesn't guarantee anything. The cheap models show the reverse failure, right idea, too many swings to land it.
Whenever your agent's work is verifiable, and this is exactly the regime that makes agents useful, budget for the tool calls, not just the tokens. The cheap model per token can be the expensive model per finished task. I only know that because I counted, and counting is the whole point.
If you want to count on your own queries: just describe my setup to your AI assistant and wire in ExoBench over MCP which will run the actual data. You can point your own assistant at it and watch the tool calls add up.
Appendix: the exact prompt
Every model got the same ExoBench-agent system prompt (paraphrased): you're a SQL performance engineer with web search and ExoBench, a real benchmarking platform that executes queries and returns actual plans and timing; benchmark at multiple scales, test your hypotheses with real execution, measure don't guess, and end with a JSON fix of {preBenchmarkSql, query, rationale}.
The task prompt gave the database (Postgres), the target scale (1,000,000 rows), the schema, the query, and this data description:
Regional commerce schema. Customers, products, and warehouses each belong to exactly one of 10 regions. About 95% of orders are for a product in the customer's own region, and about 90% ship from a warehouse in the customer's own region. Every order has exactly one shipment row. Customers are about 1/50th of orders; 10,000 products (~1,000 per region); 100 warehouses (~10 per region). Single-column FK indexes on
orders(customer_id),orders(product_id),orders(warehouse_id). The query powers a regional operations report.
The schema:
CREATE TABLE customers  (id INT PRIMARY KEY, region_id INT NOT NULL, name TEXT NOT NULL);
CREATE TABLE products   (id INT PRIMARY KEY, region_id INT NOT NULL, price NUMERIC(10,2) NOT NULL);
CREATE TABLE warehouses (id INT PRIMARY KEY, region_id INT NOT NULL, name TEXT NOT NULL);
CREATE TABLE orders     (id INT PRIMARY KEY, customer_id INT NOT NULL, product_id INT NOT NULL,
                         warehouse_id INT NOT NULL, amount NUMERIC(10,2) NOT NULL);
CREATE TABLE shipments  (order_id INT PRIMARY KEY, shipping_cost NUMERIC(8,2) NOT NULL,
                         shipped_at TIMESTAMP NOT NULL);

CREATE INDEX idx_orders_customer_id  ON orders(customer_id);
CREATE INDEX idx_orders_product_id   ON orders(product_id);
CREATE INDEX idx_orders_warehouse_id ON orders(warehouse_id);
The models were also handed a parameterized version of this schema (with a ${SCALE} placeholder and the skewed data generation) to feed into their benchmark calls, and told their fix would be graded at 1M rows. The rest was up to them: try a better query, a better index, or any other change, and measure everything.